
Figure 1.
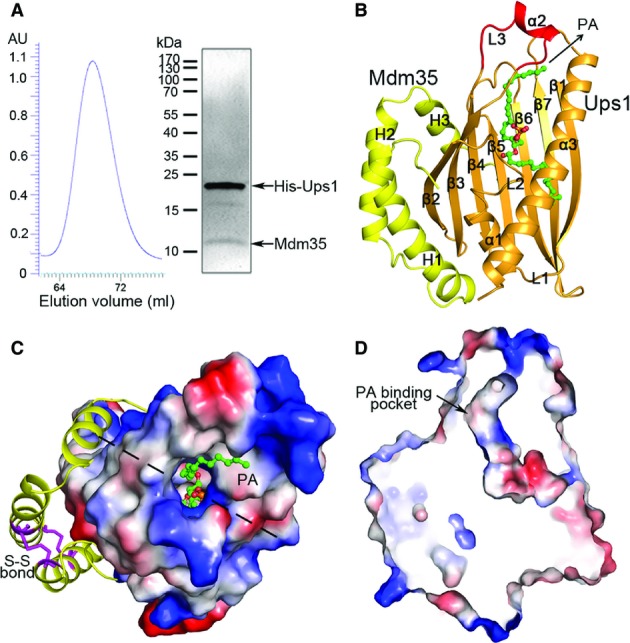
Structure of the Ups1-Mdm35-PA complex
- Purification of the Ups1-Mdm35 complex. Left panel: gel filtration chromatography profile of Ups1-Mdm35; right panel: SDS–PAGE of the purified complex stained with Coomassie blue.
- Overall structure of Ups1-Mdm35-PA in ribbon cartoon. Ups1 is colored in orange and Mdm35 in yellow; the bound di 16:0 PA is shown with a ball-and-stick model in green.
- Structure of Ups1-Mdm35-PA viewed from the top. Ups1 is shown with electrostatic potential surface (blue and red colors represent positive and negative charges, respectively) with the L3 loop and the α2 helix omitted to show the PA-binding pocket more clearly. Mdm35 is shown with ribbon cartoon with the disulfide bonds shown with magenta sticks. The dotted lines indicate the cross section position of (D).
- A cross section drawing of the complex showing the PA-binding pocket in Ups1.
Data information: Structural data have been deposited with the Protein Data Bank (PDB) under accession numbers 4XHR for Ups1-Mdm35 and 4XIZ for Ups1-Mdm35-PA.