
Figure 3.
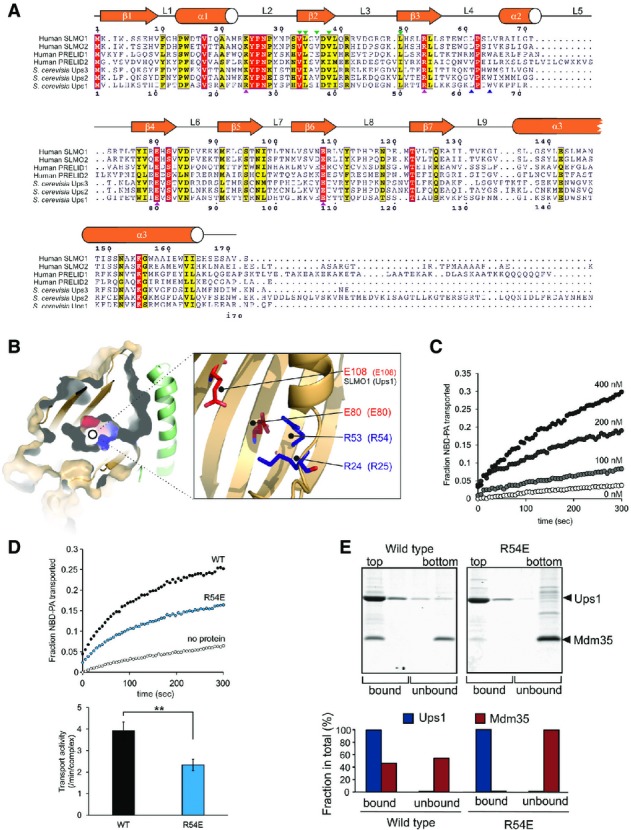
The phospholipid head group-binding cavity within SLMO1
- Protein sequence alignment for the PRELI domain protein family. Positions of secondary structural elements and loops for SLMO1 are numbered above the alignment. Numbering for the S. cerevisia Ups1 sequence is indicated below the alignment. The locations of the charge and loop mutations are highlighted with magenta and blue triangles, respectively. Interface mutations are highlighted with green triangles. Red shading indicates invariant residues across the homologues, and yellow shading indicates locations where there are conserved residues in at least four homologues.
- Left panel: cut-through of the solvent-exposed surface for SLMO1 revealing the partially hydrophilic cavity. SLMO1 surface is coloured orange with positive and negative charge residues coloured blue and red, respectively. Right panel: cartoon representation showing four conserved charged side chains that are proximal to the cavity.
- NBD-PA transfer by the TRIAP1-SLMO1 complex. Donor liposomes (12.5 μM; DOPC/DOPE/CL/Lac-PE/NBD-PA/Rhod-PE = 50/18/15/10/5/2%) and acceptor liposomes (50 μM; DOPC/DOPE/CL/Lac-PE/DOPA = 50/20/15/10/5%) were incubated for 5 min with indicated concentration of TRIAP1-SLMO1 and the NBD fluorescence was monitored. Values were normalised to the NBD fluorescence of liposomes lacking quenching Rhod-PE.
- PA transfer for native and R54E Ups1-Mdm35 complexes. Upper panel: NBD-PA transfer by the Ups1-Mdm35 complex and Ups1R54E-Mdm35. Donor liposomes (12.5 μM; DOPC/DOPE/CL/Lac-PE/NBD-PA/Rhod-PE = 50/28/5/10/5/2%) and acceptor liposomes (50 μM; DOPC/DOPE/CL/Lac-PE/DOPA =50/30/5/10/5%) were incubated for 5 min with 10 nM of Ups1-Mdm35 or mutant, and the NBD fluorescence was monitored. Values were normalised to the NBD fluorescence of liposomes lacking quenching Rhod-PE. Lower panel: quantitative assessment of the transport activity. Values are represented as the number of NBD-PA transported per complex in a minute. Columns and error bars indicate the mean ± SD. n = 4. Student's t-test was used to calculate P-values. **P < 0.01.
- Binding to PA-containing liposomes. Purified Ups1-Mdm35 complex or its mutant variant was incubated with liposomes composed of DOPC/POPE/DOPA (50/30/20%), and binding was assessed by flotation of liposomes in a sucrose gradient. Upper panel: fractions after sucrose gradient were analysed by SDS–PAGE and CBB staining. All liposomes were recovered in the upper two fractions. Lower panel: quantification of Ups1 and Mdm35. Signals in upper two fractions (bound) or lower two fractions (unbound) were quantified and are represented as a fraction in total signals of all four fractions.