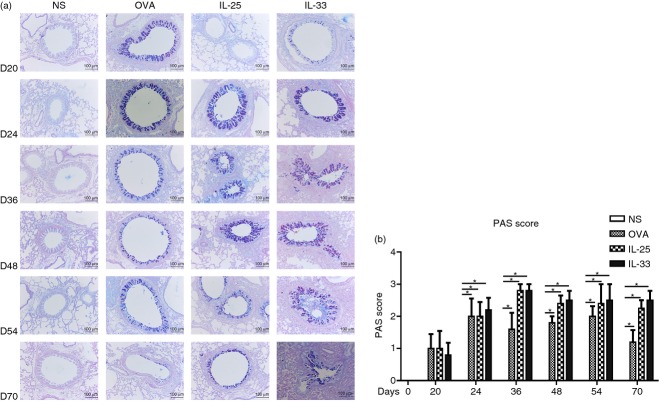
Figure 3.
(a) Representative photomicrographs of periodic acid-Schiff (PAS) stained lung sections from interleukin-33 (IL-33), IL-25, ovalbumin (OVA) and saline (NS) -challenged mice at various time-points (original magnification ×20). (b) Mucus score based on PAS staining (see Materials and methods). Bars show the mean ± SEM (n = 5 in each group at each time-point). *P < 0·05.

