
Figure 5.
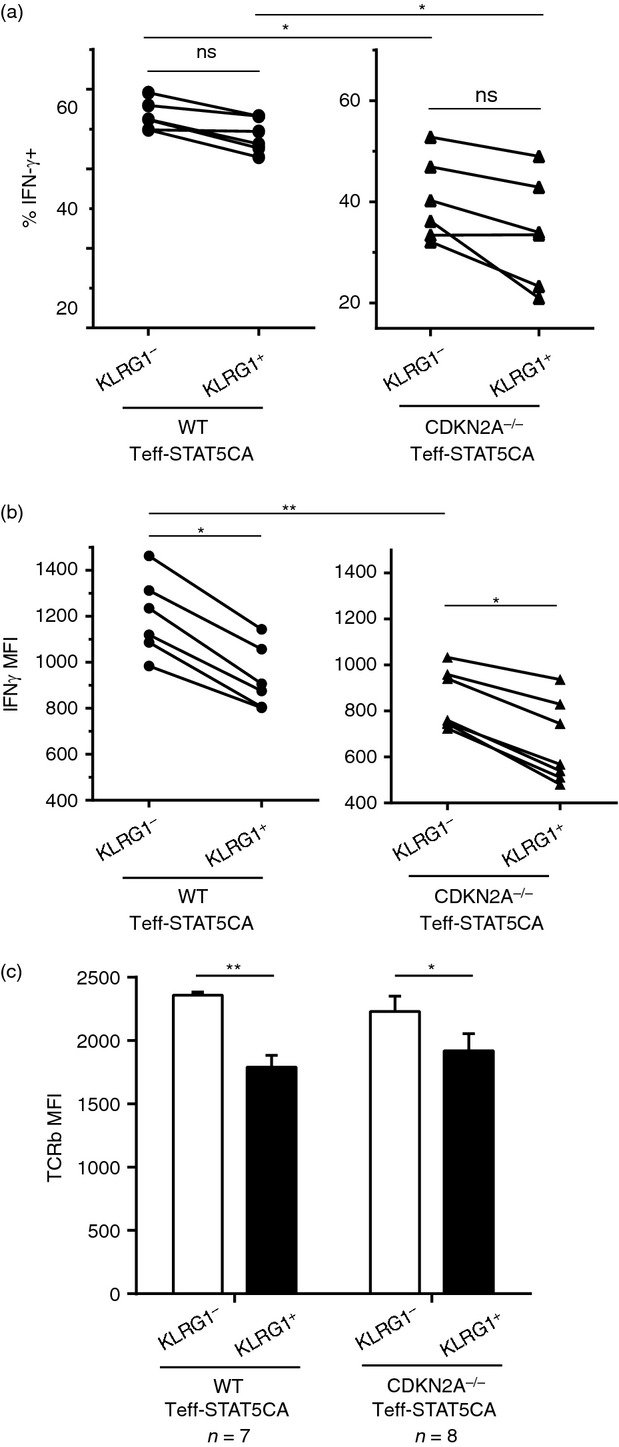
Comparison of interferon-γ (IFN-γ) production by KLRG1-positive (KLRG1+) T cells and their KLRG1− counterparts. (a, b) Cells were stimulated for 4 hr with anti-CD3 bound on a FcRγ+ tumour in the presence of monensin and stained for IFN-γ. For KLRG1hi and KLRG1lo T cell subpopulations, % IFN-γ-positive cells are shown in (a) and the MFI for IFN-γ staining is reported in (b). Data are representative of three independent experiments. (c) Surface staining for CD8, KLRG1 and TCR-β were performed. For KLRG1hi and KLRG1lo T subpopulations, the MFI for TCR-β staining is reported.