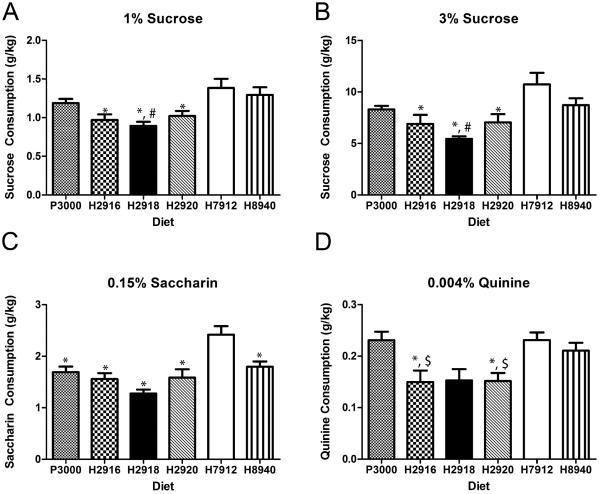
Figure 3.
Animals on diet H7912 consumed more sucrose compared with mice on diets H2920, H2916, and H2918 (panels A & B). Mice on diet H8940 also consumed more sucrose than those on diet H2918. In regards to saccharin, only mice on diet H7912 were significantly different, consuming more of the sweetener than all other groups (panel C). Both the P3000 and H7912 diet groups consumed more quinine solution than those on diets H2920 or H2916 (panel D) * indicates less than H7912; # less than H8940; $ less than P3000. Significance was set at p<0.05 (two-tailed), and all data are expressed as mean ± SEM.

