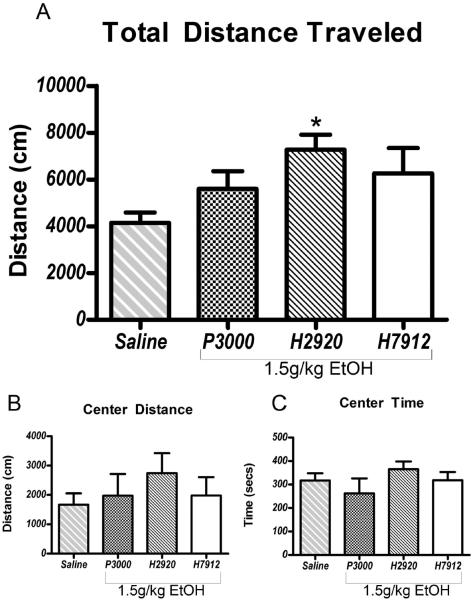
Figure 5.
Mice on diet H2920 showed a greater sensitivity to ethanol-induced locomotor activity, as evidenced by increased total distance traveled compared with the saline group (panel A;). No differences were seen in center distance traveled or time spent in the center of the chamber (panels B & C). Significance was set at p<0.05 (two-tailed), and all data are expressed as mean ± SEM.

