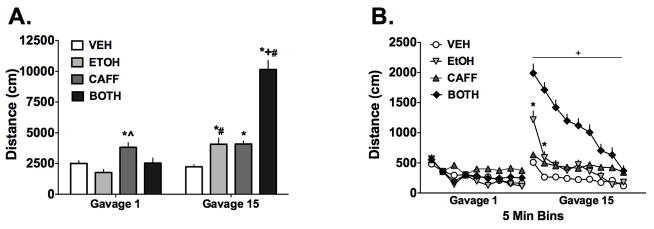
Figure 3. Repeated gavage of ethanol or ethanol plus caffeine produces locomotor sensitization.

A) Total distances traveled following the 1st gavage were only increased in the CAFF group compared to vehicle but by the 15th gavage, the EtOH, CAFF and BOTH (i.e. EtOH + CAFF) groups showed increased activity compared to VEH. Further, the EtOH and BOTH groups demonstrated significantly increased activity by the last gavage compared to the first with the increase in activity for the BOTH group being particularly robust (n=12–20/grp). B) The same data shown as a within-session time course and demonstrate that for the EtOH and BOTH groups, the increased activity after the 15th gavage was greatest at the beginning of the session and declined with time. Data are means ± S.E.M. (*=p<0.05 compared to vehicle group, ^=p<0.05 compared to ethanol group, #=p<0.05 compared to same exposure group gavage 1)
