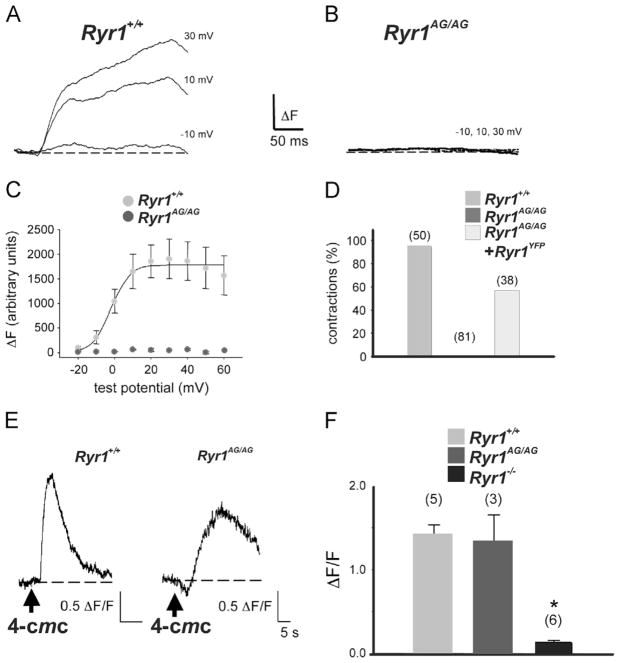
Fig. 2.
Ryr1AG/AG show defects in calcium dynamics. (A, B) Representative recordings of myoplasmic Ca2+ transients elicited by 50-ms depolarizations from −50 mV to the indicated test potentials for locomotor normal myotubes (A; Ryr1+/ +) and Ryr1AG/AG myotubes (B). (C) Comparison of ΔF−V relationships for normal myotubes (light gray circles; n=4), and Ryr1AG/AG myotubes (dark gray circles; n=7). (D) Fraction of myotubes that contract in response to a 100 V, 10 ms electrical stimulus for normal myotubes (light gray bar), Ryr1AG/AG myotubes (dark gray bar, 0%), and Ryr1AG/AG myotubes transfected with RyR1-YFP (white bar). (E) Representative changes in Fluo-3 AM fluorescence in response to application of 4-chloro-m-cresol (4-CmC; 0.5 mM) elicited in a normal myotube (left) and Ryr1AG/AG myotube (right). Arrows indicate time of 4-CmC applications. (F) Half-rise times of Ca2+ transients in response to 4-CmC for normal (light gray bar), and Ryr1AG/AG (dark gray bar) myotubes compared to Ryr1−/− (black bar). Error bars represent ± SEM. Asterisks indicate a significant difference (p=0.006; t-test). For each group in (D) and (F), the total number of myotubes tested is indicated above each bar.

