
Fig 16.
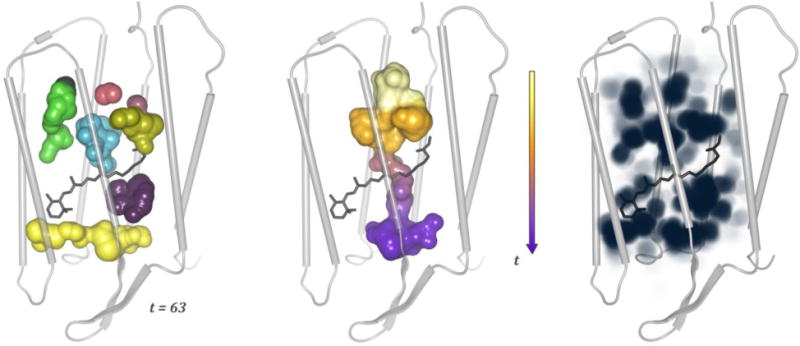
Cavity dynamics in a bacteriorhodopsin monomer. From left to right: the cavities traced at time step t = 63, a channel created by the dynamics from t = 50 till t = 64, and the overall spatial cavity probability (depicted with maximum intensity projection). The images are based on Refs. (Lindow et al., 2012a; Lindow et al., 2013)