
Fig 17.
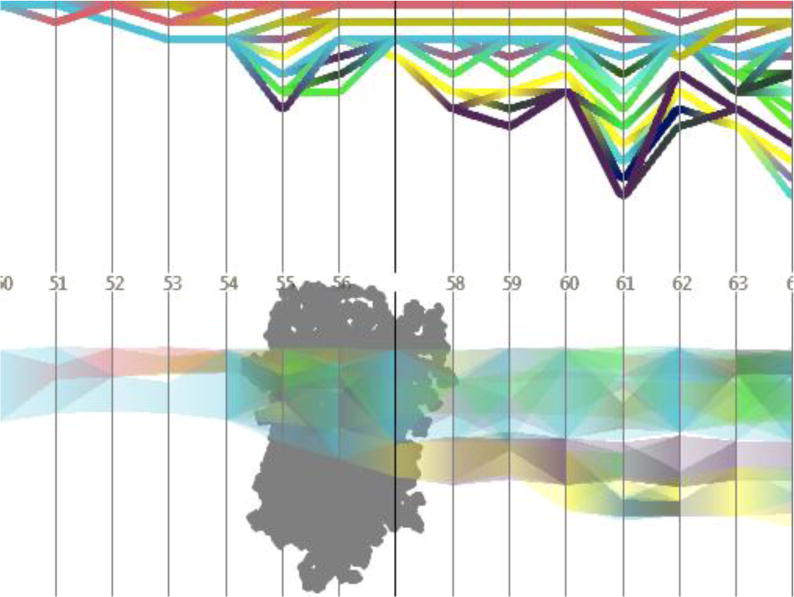
Temporal development of cavities in a bacteriorhodopsin monomer (for the simulation and the time steps also used in Figure 16); upper diagram: topology graph showing splits and merges of cavities; lower diagram: penetration graph depicting the cavities’ location along a user-defined axis. The image is based on Refs. (Lindow et al., 2012a; Lindow et al., 2013)