
Fig 7.
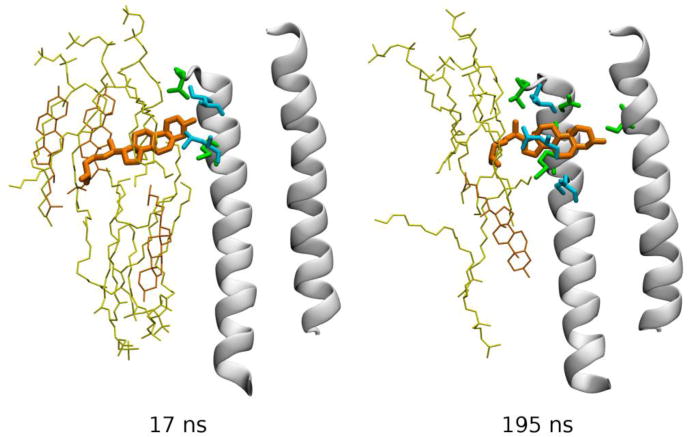
Spontaneous re-binding of cholesterol to an intersubunit cleft in the GABAA receptor. Two frames from a simulated MD trajectory are shown (Hénin et al., 2014). TM helices M2 (right) and M3 (left) forming the back of the pocket are shown as white cartoon, and cholesterol as orange bonds. Other specific groups are depicted as bonds using the following color code: yellow – phospholipid, orange – membrane cholesterol, green – protein amino acid residues from the back receptor subunit, and cyan – protein groups from the front receptor subunit. Data from (Hénin et al., 2014).