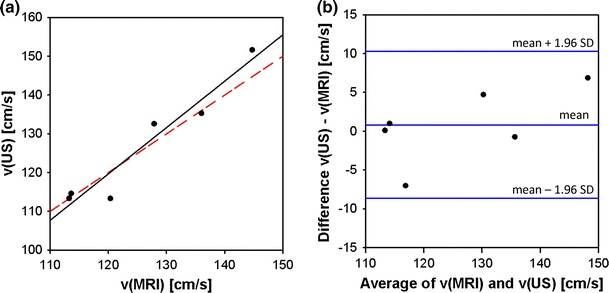
Fig. 4.

Bland–Altman statistics for method validation of 4D PC MRI against ultrasound, obtained in vivo in mice for the ascending aorta. a Plot of peak flow velocities obtained by ultrasound and by 4D PC MRI showing linear regression (black line; R 2 = 0.9304) and line of identity (red dashed line). b Bland–Altman plot for method comparison: all observed data points are included in narrow limits of the interval amplitude, indicating good agreement of both methods.
