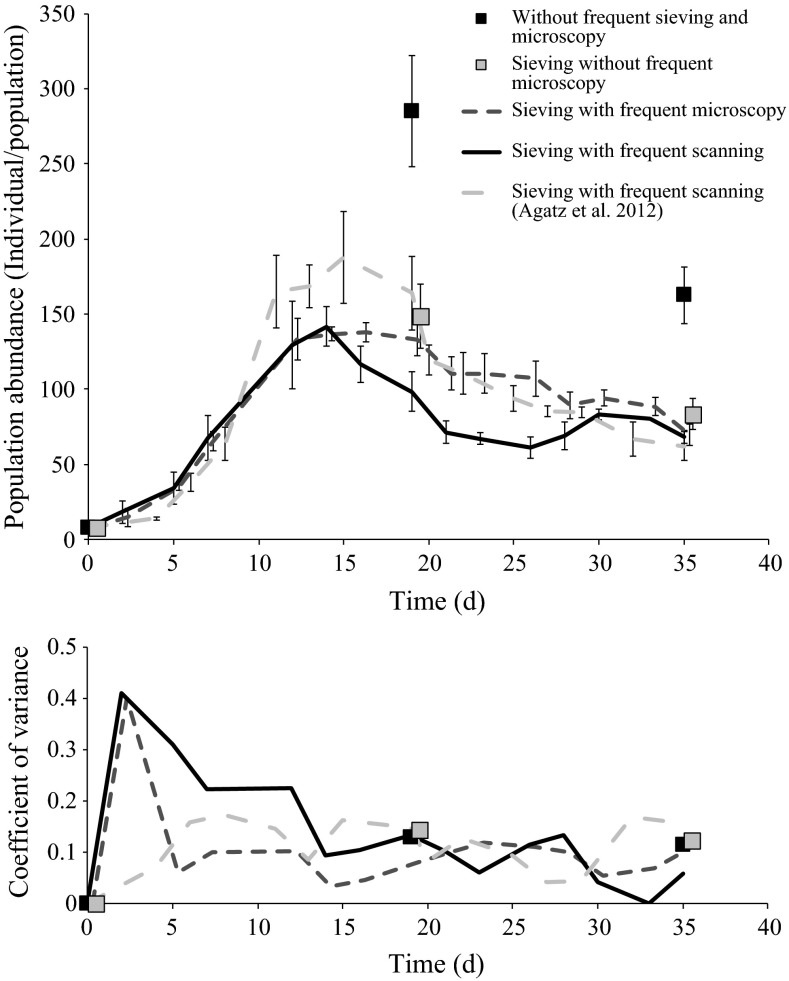
Fig. 2.
Average total abundance of Daphnia magna populations (top) and the corresponding coefficients of variances (bottom) over time. Shown are the four treatments of the Population test and the control treatment of another population test (Agatz et al. 2012)

