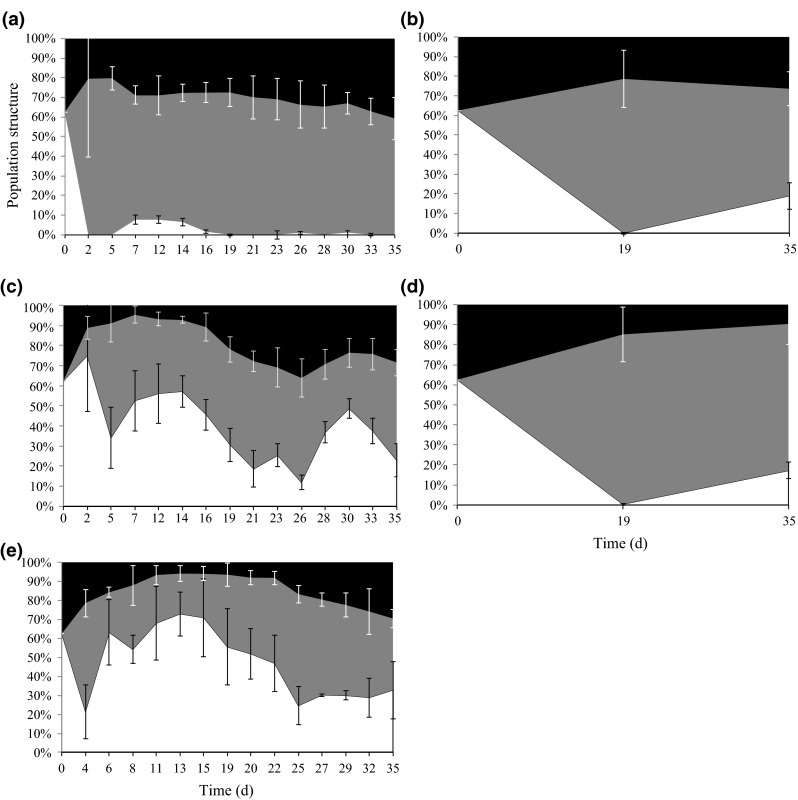
Fig. 3.

Population structure (% neonates (white), juveniles (grey) and adults (black)) of the total population abundance of Daphnia magna over time. Shown is the average (±SD) of the four treatments from the population test a sieving with frequent microscopy, b sieving without frequent microscopy, c sieving with frequent scanning, d without frequent sieving, e sieving with frequent scanning of another population test (Agatz et al. 2012). Adults (body length > 2.6 mm); juveniles (body length 1.4–2.6 mm); neonates (body length < 1.4 mm)
