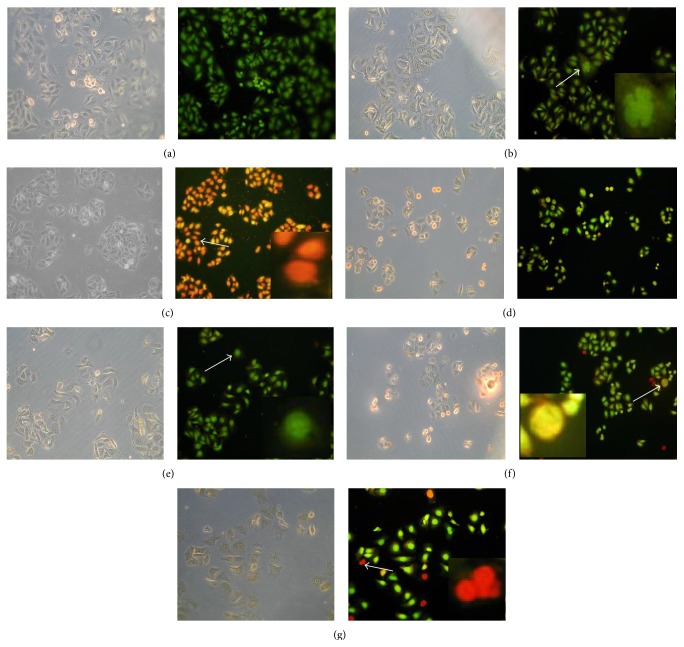
Figure 6.
Effect of 6MPTOX on the prostate cancer cells (PC3). (a) Negative control; (b) apoptosis control; (c) necrosis control; (d–g) cells exposed to different concentrations of 6MPTOX; (d) 0.001 μM; (e) 0.002 μM; (f) 0.005 μM; (6) 0.011 μM. The arrow points out the cells that were amplified (40x). (b) Apoptotic cells; (c) necrotic cells; (e) apoptotic cells (0.002 μM); (f) late apoptosis (0.005 μM); (g) necrotic cells (0.011 μM).

