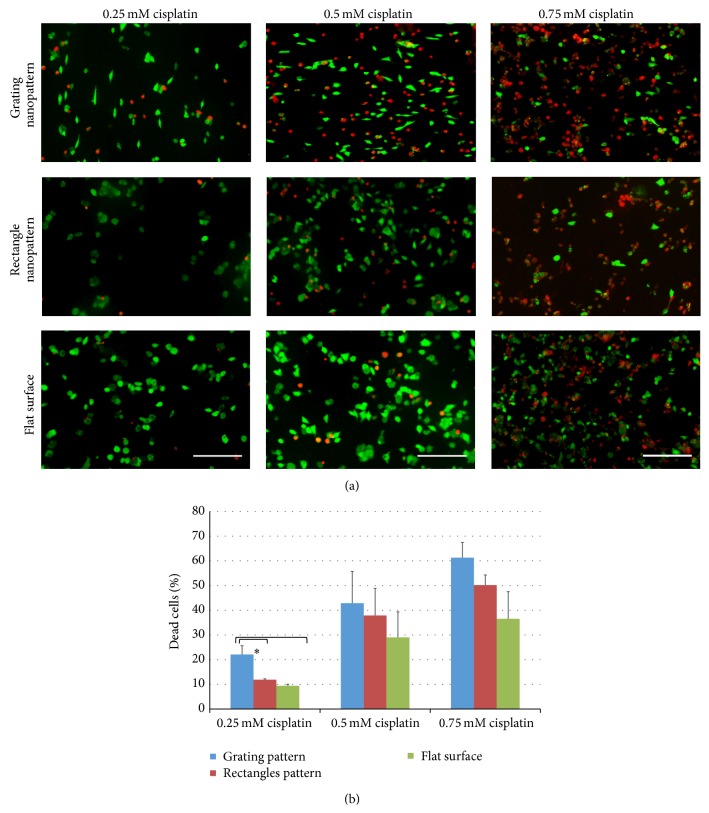
Figure 2.
(a) Live/dead fluorescence staining of HepG2 cells cultured on the diversified geometry of nanopattern (grating and rectangles) and flat surface, on which green cells are alive cells and red cells are dead cells. (b) Average percentages of dead cells (n ≥ 3) upon culturing HepG2 on different substrates with various cisplatin concentrations. ∗Statistically significant at P < 0.05. Scale bar = 200 μm.

