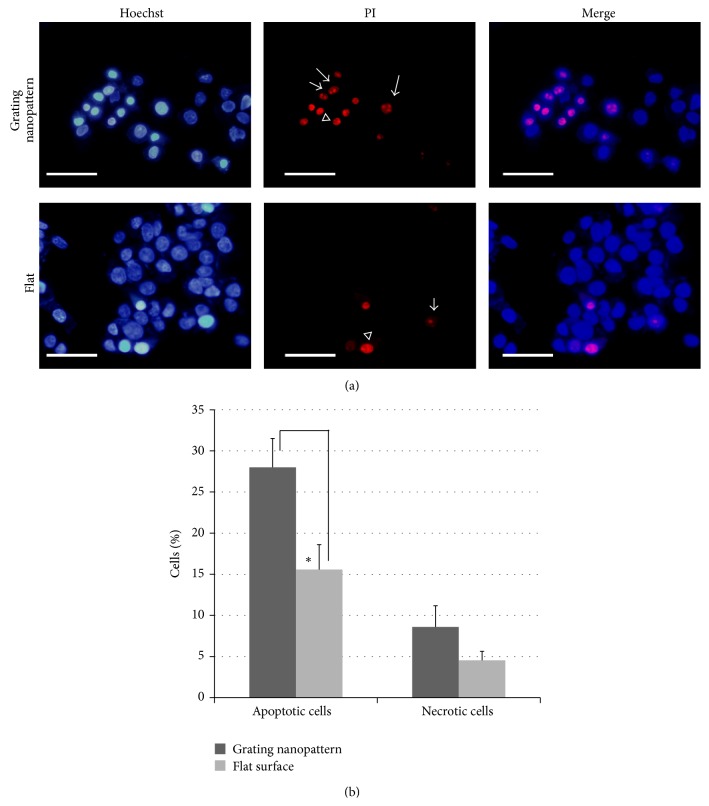
Figure 5.
(a) Fluorescent staining of HepG2 cellular nuclei cultured on grating nanopattern (upper panel) and a flat surfaces (lower panel). Arrows show phenotype I (apoptotic cells), and arrowheads show phenotype II (necrotic cells) (scale bar = 50 μm). (b) Alteration in number of cells cultured on various substrates showing different phenotypes of chromatin condensation induced by the presence of cisplatin. The percentage of apoptotic phenotype induced by cisplatin was significantly higher in cultures on the grating nanopattern substrate. ∗ P < 0.001.

