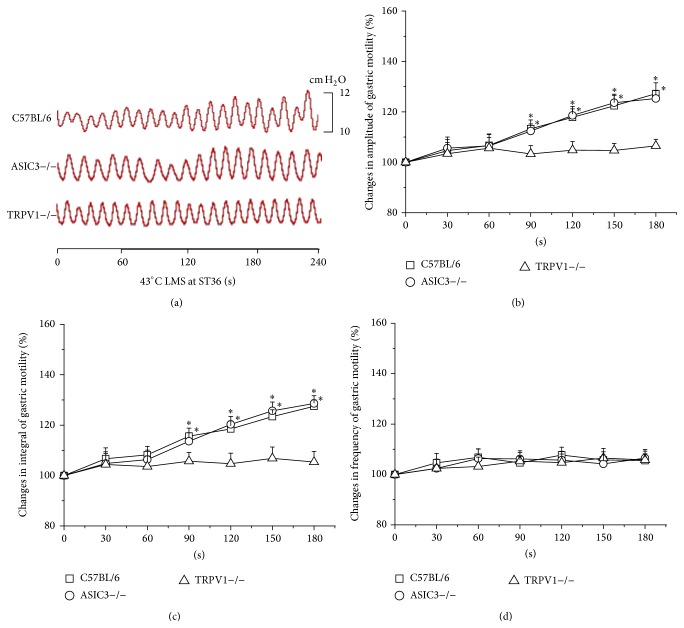
Figure 2.
Modulation of gastric motility by 43°C LMS at ST36 among three groups of mice. (a) Representative examples of the alterations of gastric contraction wave induced by 43°C LMS at ST36. (b), (c), and (d) display the pooled data corresponding to the effects of 43°C LMS at ST36 on the amplitude, integral, and frequency of gastric motility in 180 s, respectively. Values before LMS application are presented as 100% and the rates of change are calculated during LMS in each 30 s (* P < 0.05, compared with the values before LMS application).

