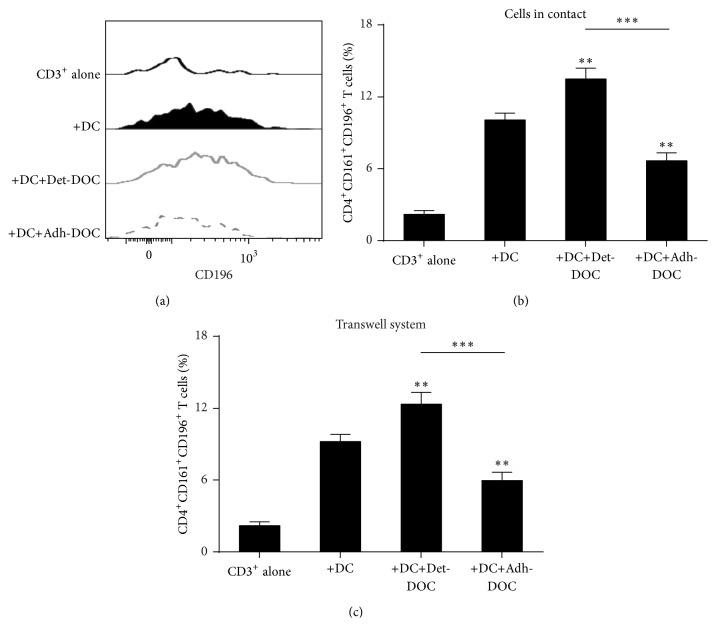
Figure 4.
Induction of CD4+CD161+CD196+ T cell by DC in the presence of hDOC. CD3+ T cells were cultured for 5 days with allogeneic immature DC, alone (positive control), or with either Det-DOC or Adh-DOC Det-DOC or Adh-DOC. The ratios of seeded cells in coculture were the following: CD3+ : DC : DOC = 20 : 1 : 1. (a) CD196 staining of the CD4+CD161+ cells fraction within CD3+ T cells, either cultured alone (black line) or cultured with DC (black filled) or cultured with DC in presence of either Det-DOC (grey line) or Adh-DOC (dashed grey line). (b) Histograms show the percentage of T cells coexpressing CD4, CD161, and CD196. (c) The same experiment as in (a) and (b), performed in a 0.4 μm pore polycarbonate transwell system. Upper chamber: CD3+ T cells. Lower chamber: DC and DOC. Histograms represent the mean ± SEM of 7 independent experiments. ∗∗ = p < 0.01, ∗∗∗ = p < 0.001, Bonferroni corrected.

