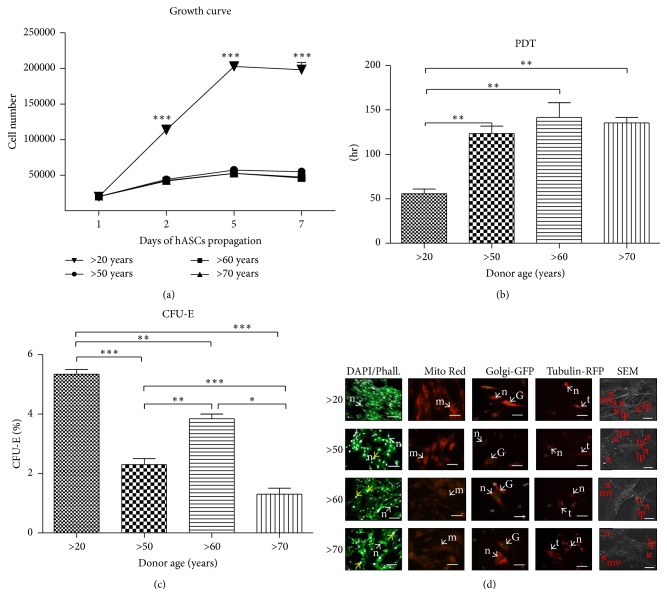
Figure 2.
Effect of age on hASCs morphology, growth kinetics, and clonogenic potential. Mean cell number for each age group with respect to culture duration (a). Significant differences in proliferation potential were observed between younger (>20) and older patients (50–70). Cell population doubling time expressed according to donor age (b). CFU-E assay showing percentage of colonies consisting of more than 50 cells between different age groups (c). Morphology and cellular composition of hASCs from different age groups, evaluated after seven days of propagation (d). Typical morphological features were indicated with proper abbreviations: n: nucleus, m: mitochondria, G: Golgi apparatus, t: microtubules, mv: microvesicles, lp: lamellipodia, and fp: filopodia. Enlarged nuclei were pointed out with yellow arrows. Magnification: DAPI/Phalloidin (DAPI/Phall.) ×100, scale bar: 250 μm; Mito Red, Golgi-GFP, Tubulin RFP: ×200, and scale bars 125 μm; SEM: ×2000, scale bars: 30 μm. Results expressed as mean ± SD. ∗ P value < 0.05, ∗∗ P value < 0.01, and ∗∗∗ P value < 0.001; (>20), (>50), (>60), and (>70): donor age range.

