Figure 5.
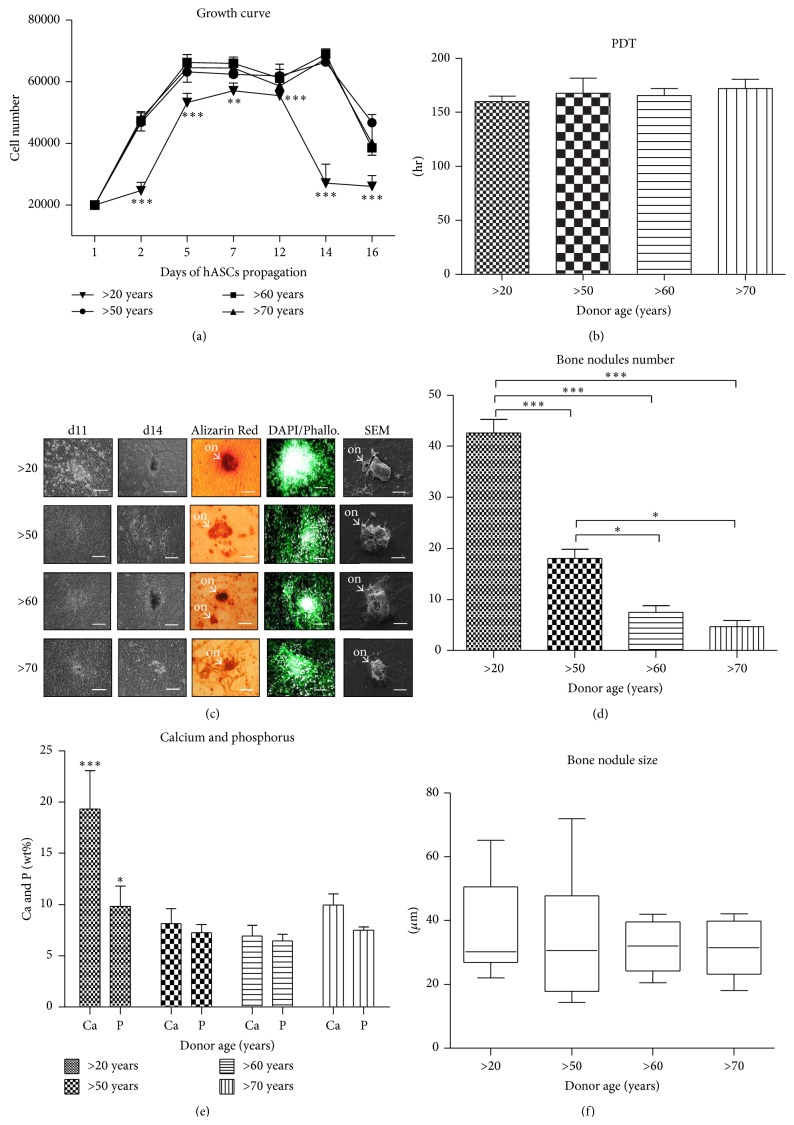
Age-related changes in hASC cultured under osteogenic conditions. Growth curves (a), population doubling time (b). Morphological evaluation after 16 days of culture, magnification ×100, scale bars: 250 μm; SEM pictures; magnification ×2000, scale bars: 20 μm (c). Mean bone nodules number (d), composition of mineral matrix (e), and average nodules diameter (f). Results expressed as mean ± SD. ∗ P value < 0.05, ∗∗ P value < 0.01, and ∗∗∗ P value < 0.001. (>20), (>50), (>60), and (>70): donor age range; d11: day 11th, d14: day 14th, and on: osteo-nodule.

