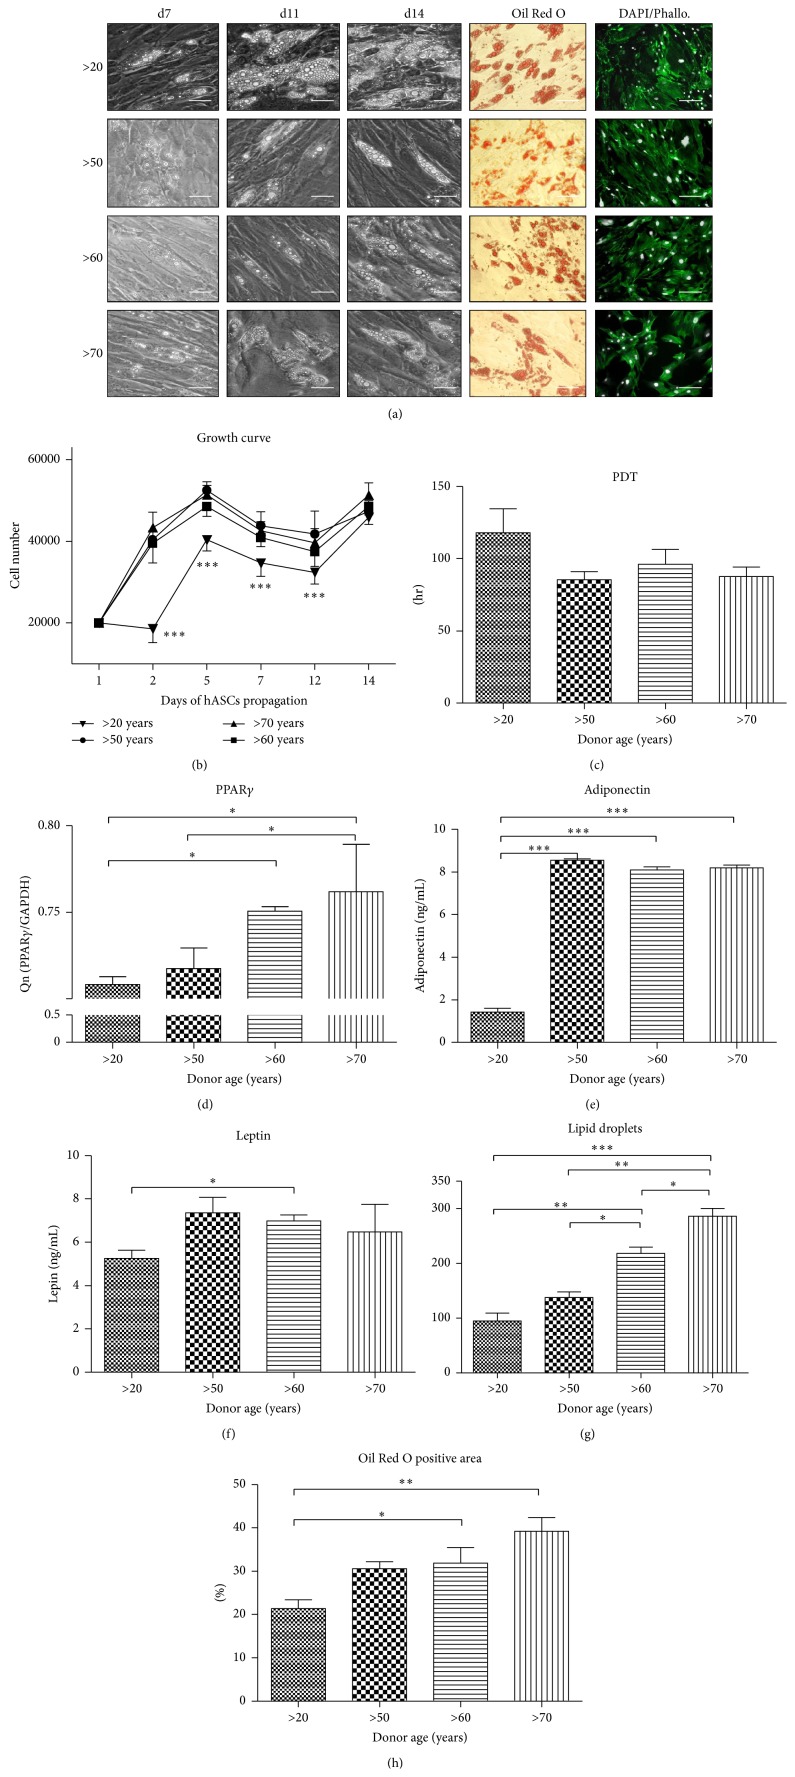
Figure 9.
Adipogenic differentation analysis. Morphological evaluation on 7th, 11th, and 14th day. Oil Red O and DAPI/Phalloidin staining performed on 14th day (a); magnification ×100, scale bars: 77 μm; Oil Red O and DAPI/Phallo. Magnification ×100, scale bars: 250 μm. Growth curve (b) showing significantly slower proliferation rate in young patients (>20). No statistically important differences in population doubling time were seen between the different age groups (c). Expression level of PPARγ (d) and concentration of leptin (e) and adiponectin (f) in the supernatants on the 14th day, measured with ELISA assay. Obtained data display differences in leptin amount between >20 and >60 patients, respectively, as well as age-related increase in adiponectin expression in hASC obtained from older subjects (50–70 years). Quantification od adipogenesis using ImageJ software: lipid droplets number (g) and Oil Red O positive area (h). Results expressed as mean ± SD. ∗ P value < 0.05, ∗∗∗ P value < 0.001. (>20), (>50), (>60), and (>70): donor age range, d7: day 7th, d11: day 11th, and d14: day 14th.

