
Fig. 10. Analysis method for vertical anastomosis assay.
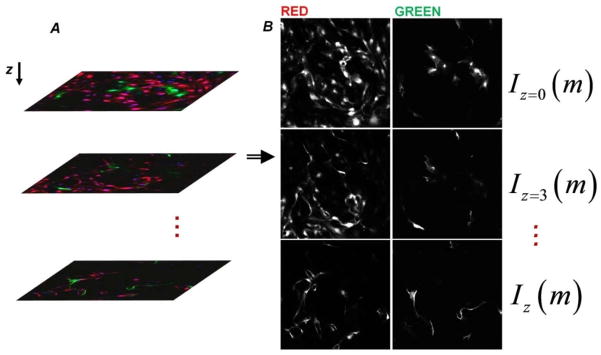
(A) Stacks of 3μm-spaced images were collected using confocal microscopy. Every well represents an independent experiment. Three random non-overlapping locations within a well were used for averaging. (B) A custom Matlab® code was created to separate the red and green channels from the collected image stacks. The total intensity of an image (I) is tracked along z-direction to characterize the distribution of red and green structures. m is the linear index of the intensity matrix elements.