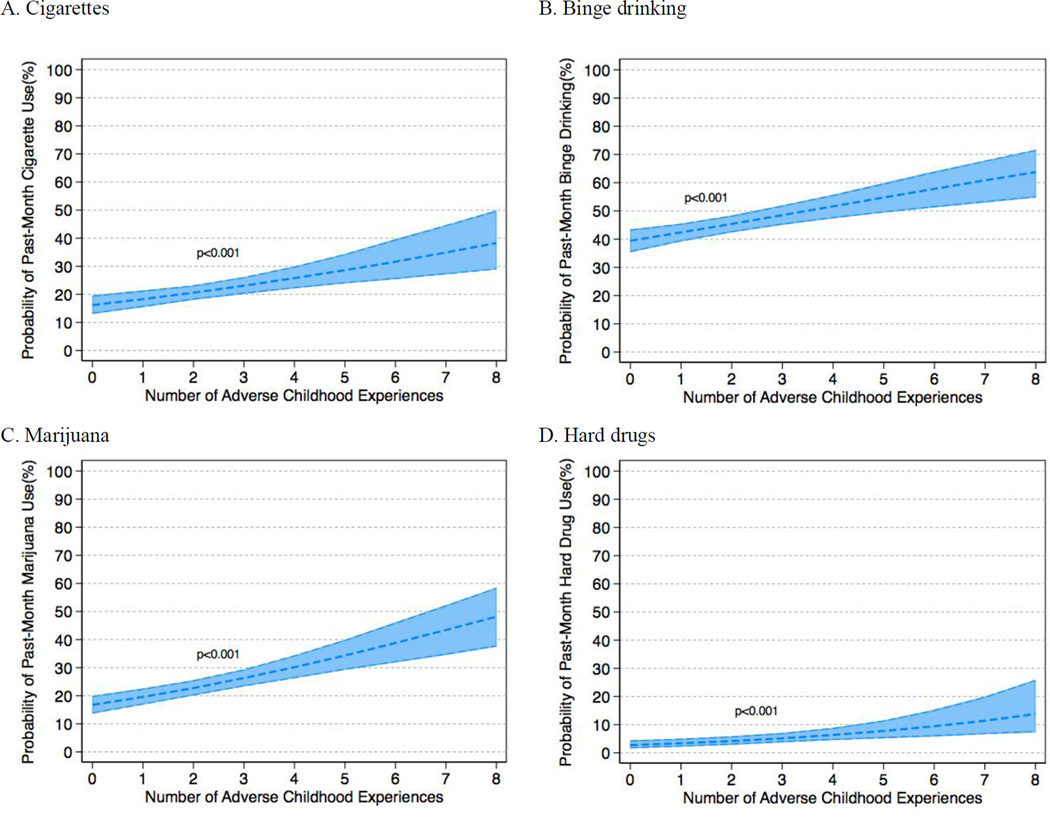
Figure 1. Accumulated number of adverse childhood experiences and substance use.
(A) Shows the predicted probability of past-month cigarette use, (B) past-month binge drinking, (C) past-month marijuana use, and (D) past-month hard drug use by number of number of adverse childhood experiences. Quantities of interest were calculated by using the estimates from each multivariable analysis by simulation using 1,000 randomly drawn sets of estimates from a sampling distribution with mean equal to the maximum likelihood point estimates, and variance equal to the variance-covariance matrix of the estimates with covariates held at their mean values.

