
Figure 1. TPMT allele frequency (combined *2, *3A, *3B and *3C) distribution in North and South America [52–59].
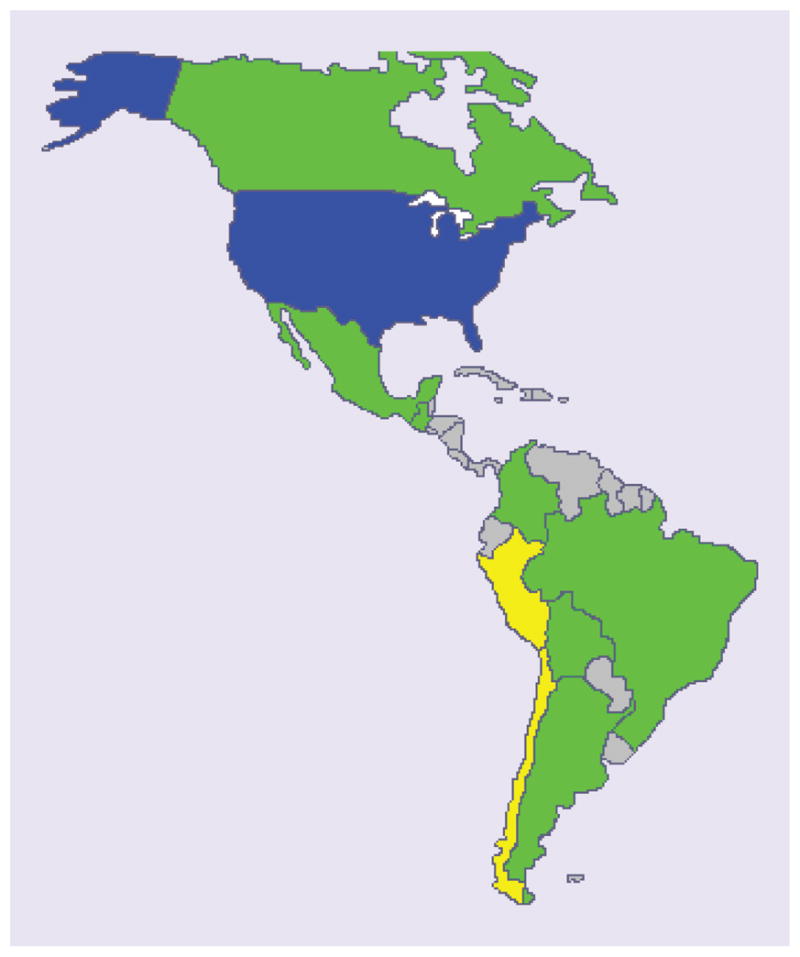
USA Caucasian (blue) represents the reference frequency (0.04) [56]. Green = between 0.5 and 2× the reference frequency, yellow = allele frequencies greater than 2× the reference frequency, gray = unknown frequency. Allele frequencies are listed in Supplementary Table 1.