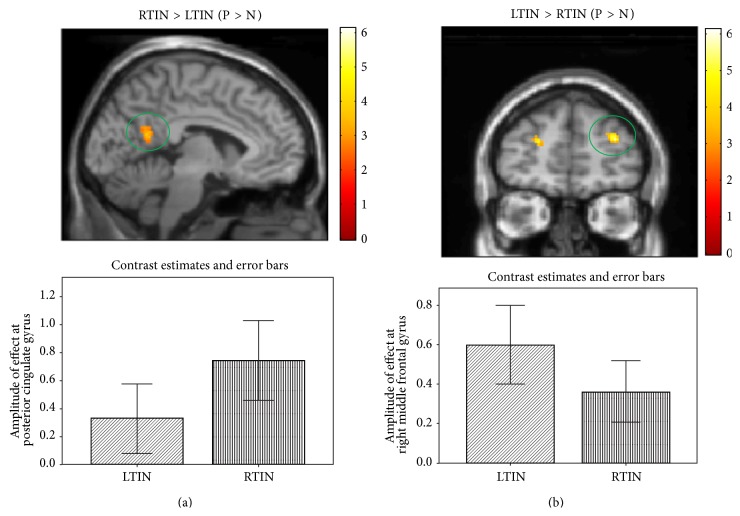
Figure 2.
Statistical parametric maps for post hoc independent sample t-tests for the emotion task. Whole-brain post hoc independent sample t-tests were used to determine group differences. (a) Statistical tests detected increased response in the posterior cingulate in the RTIN group compared to the LTIN group. (b) Statistical tests detected increased response in the right middle frontal gyrus in the LTIN group compared to the RTIN group. For better visualization, the maps are displayed at p < 0.001 uncorrected, but the circled cluster is corrected for multiple comparisons (p < 0.025 FWE).

