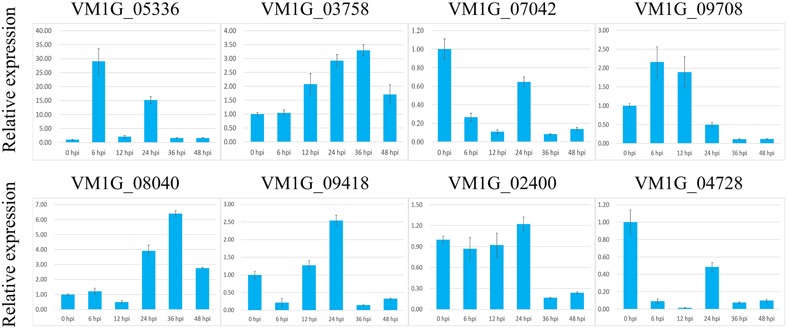
FIGURE 3.

Relative expression level of VmEps at 0, 6, 12, 24, 36, and 48 hours post inoculation (hpi) using reference gene G6PDH for normalization. Results are presented as a mean fold change in relative expression compared to the 0 hpi sampling stage. All experiments were repeated three times. Error bars indicate SEM.
