Figure 2.
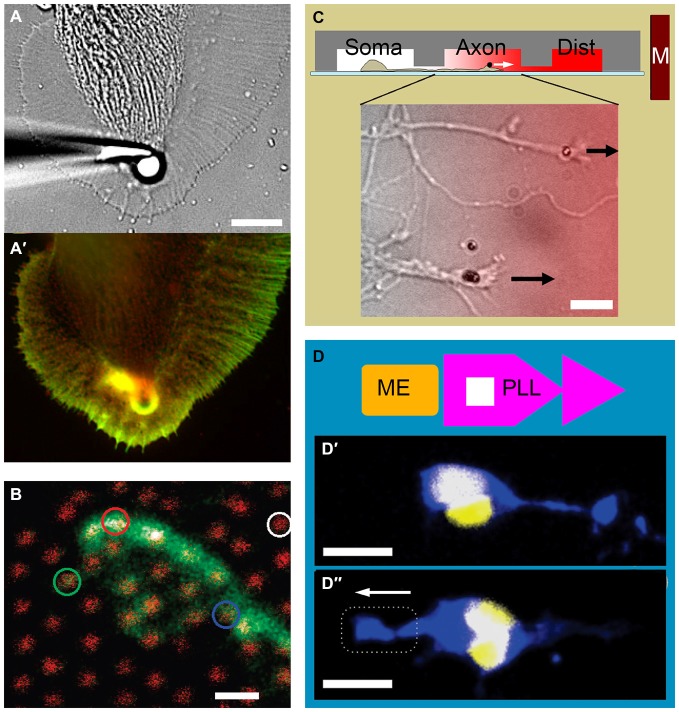
Examples of growth cone force application and measurement. (A) Force application via a 5 μm polystyrene bead coated with apCAM, restrained using a glass pipette. (A′) Actin (green) and cortactin (red) distribution in an Aplysia growth cone is visualized after 7 min of force application. Note the cytoskeletal alignment and the actin-rich arc around the bead. Adapted with permission from Decourt et al. (2009). (B) The growth cone of a mouse dorsal root ganglion neuron expressing green fluorescent protein cultured on an array of 40 nm diameter, 4 μm high gallium phosphide nanowires with 1 μm spacing (red). Adapted with permission from Hällström et al. (2010). Copyright 2010 American Chemical Society. (C) Three-compartmental microfluidic device for isolating axons and exposing them to linear concentration gradients. Soma, somatic; Axon, axonal; Dist, distal. Growth cones of mouse cortical neurons targeted with neural cell adhesion molecule (NCAM)-functionalized 1.4 μm superparamagnetic beads. Arrows indicate force direction. Overlay color indicates Semaphorin 3A gradient. Adapted from Kilinc et al. (2014). (D) Combination of adhesive patterning and force application. The substrate consists of an array of “modified fast-forward” poly-l-lysine patterns (PLL; purple) and embedded ferromagnetic elements (ME; gold). (D′) Rat cortical neurons with internalized magnetic nanoparticles polarize in the forward direction in the absence of force. (D″) Neuronal polarization is reverted in the presence of magnetic force. Neurons are stained against Tau protein (blue) and 4′,6-diamidino-2-phenylindole (DAPI; yellow). Broken line indicates magnet position. Arrow indicates force direction. Adapted with permission from Kunze et al. (2015). Copyright 2015 American Chemical Society. Scale bars = 10 μm (A), 1 μm (B), 20 μm (C), 16 μm (D).

