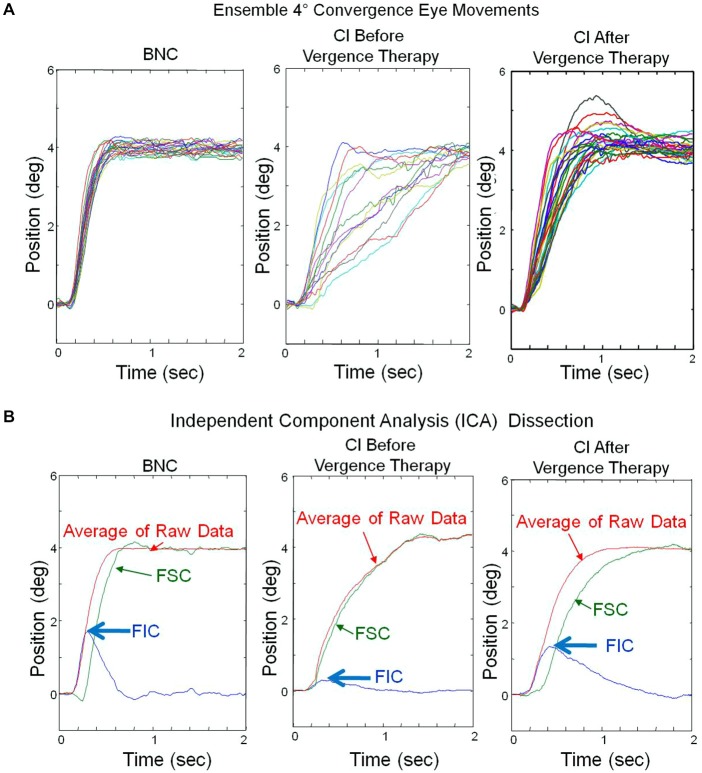
Figure 2.
(A) Ensemble convergence eye movement responses to 4° symmetrical step stimuli. Each colored trace represents a convergence eye movement. The left plot is responses from a binocularly normal control whereas the middle and right plots are from the same subject with CI before and after vergence therapy, respectively. (B) Results from the ICA of the ensemble responses from plots (A). The average of the ensemble eye movements (red), the FIC (blue) and the FSC (green) are plotted. The peak magnitude of the FIC (blue arrow) is reduced in the CI subject before vergence therapy, compared to the BNC, and increases to be more similar to the BNC after vergence therapy.

