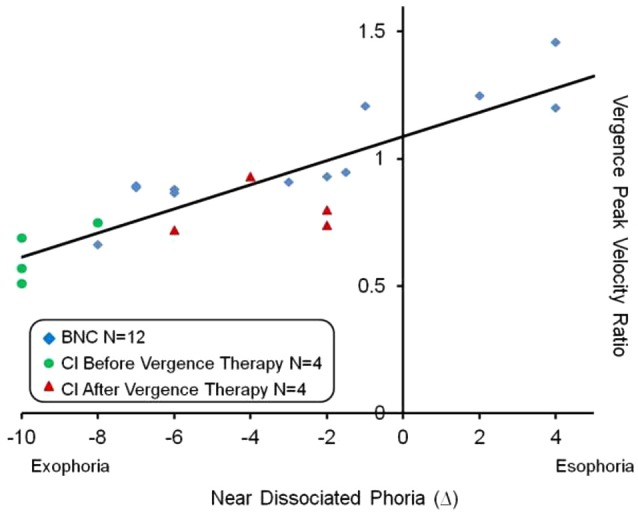
Figure 4.

Linear regression analysis of the vergence peak velocity ratio (average convergence peak velocity divided by average divergence peak velocity) as a function of the near dissociated phoria. Esophoria is denoted as positive and exophoria is denoted as negative. The BNC, CI subjects before vergence therapy and the same CI subjects after vergence therapy are shown in blue diamonds, green circles and red triangles, respectively. A significant correlation was observed (p < 0.01) and the Pearson correlation coefficient was r = 0.87.
