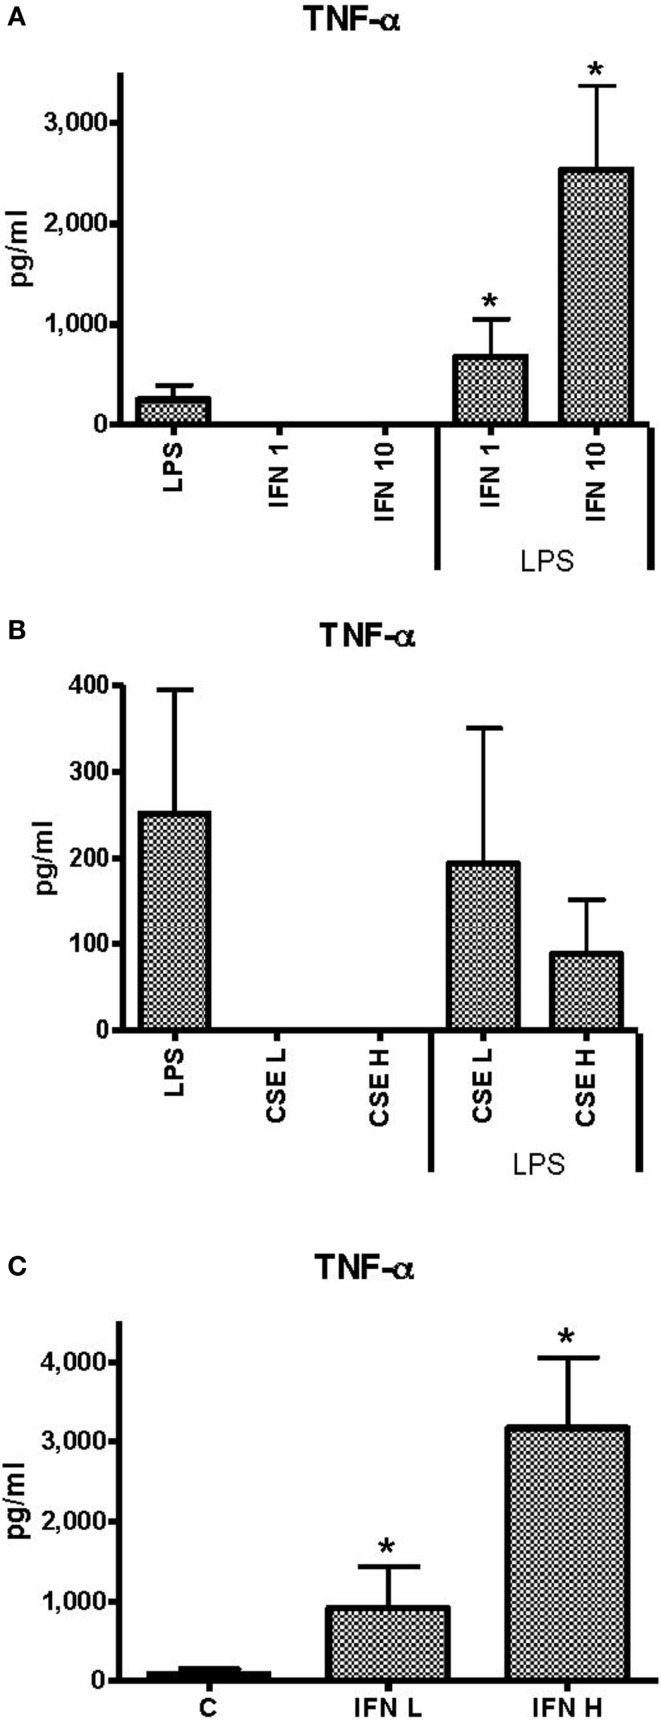
Figure 1.
Effects of IFN-γ and CSE on TNF-α responses of THP-1 cells to LPS (50 ng ml−1). (A) TNF-α responses of THP-1 cells to LPS (50 ng ml−1) and IFN-γ at 1 ng ml−1 (IFN 1) or 10 ng ml−1 (IFN 10) (*p < 0.05). (B) TNF-α responses of THP-1 cells to LPS (50 ng ml−1) and CSE at low level (CSE L = 0.0001 cig ml−1) and high level (CSE H = 0.001 cig ml−1). (C) TNF-α responses of THP-1 cell to LPS (50 ng ml−1) and CSE (0.001 cig ml−1) and IFN-γ at low level (IFN L = 1 ng ml−1) and high level (IFN H = 10 ng ml−1) (*p < 0.05).

