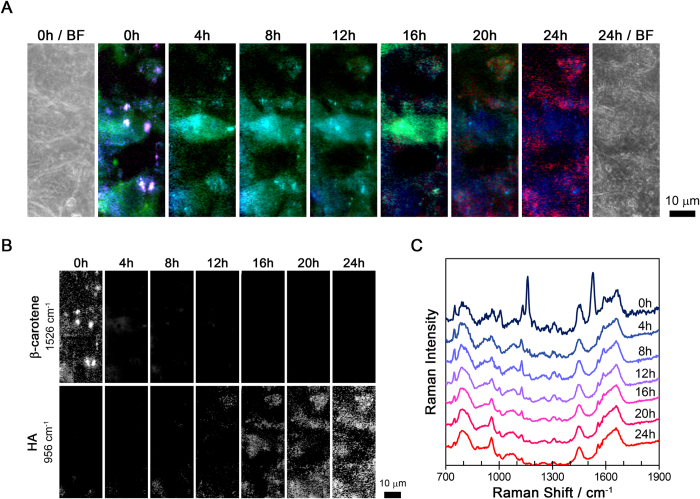
Figure 1. Time-lapse Raman analysis of the same osteoblast tissue.
(A) Bright-field and time-lapse Raman images of the osteoblasts. The Raman images show cytochrome c (750 cm−1) as green, HA (956 cm−1) as red, β-carotene (1526 cm−1) as magenta, and the CH3 stretching mode (2940 cm−1) as blue. (B) The individual time-lapse Raman images for β-carotene and HA. (C) The temporal changes in the averaged Raman spectra obtained from the same location in the osteoblasts. Each spectrum was averaged from 234 pixels (about 24 μm2).

