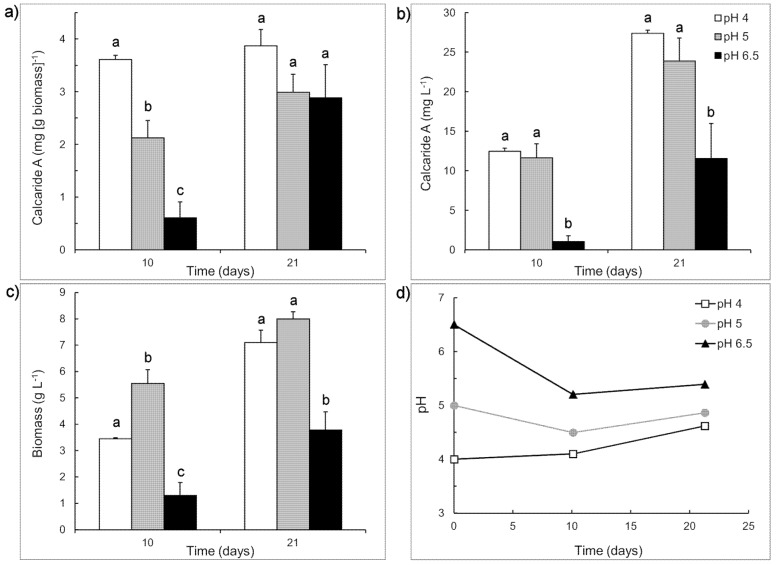
Figure 3.
Production of (a) specific and (b) volumetric calcaride A and (c) biomass by KF525 in sucrose-casamino acid medium with initial pH of 4 (white), 5 (grey) or 6.5 (black). (d) Changes in pH during the cultivation. Error bars represent + sem (n = 2 or 4) and are smaller than the size of the symbol for pH. Letters above the bars (a, b or c) indicate significant differences (p < 0.05) for values measured at the same time (Day 10 or Day 21).

