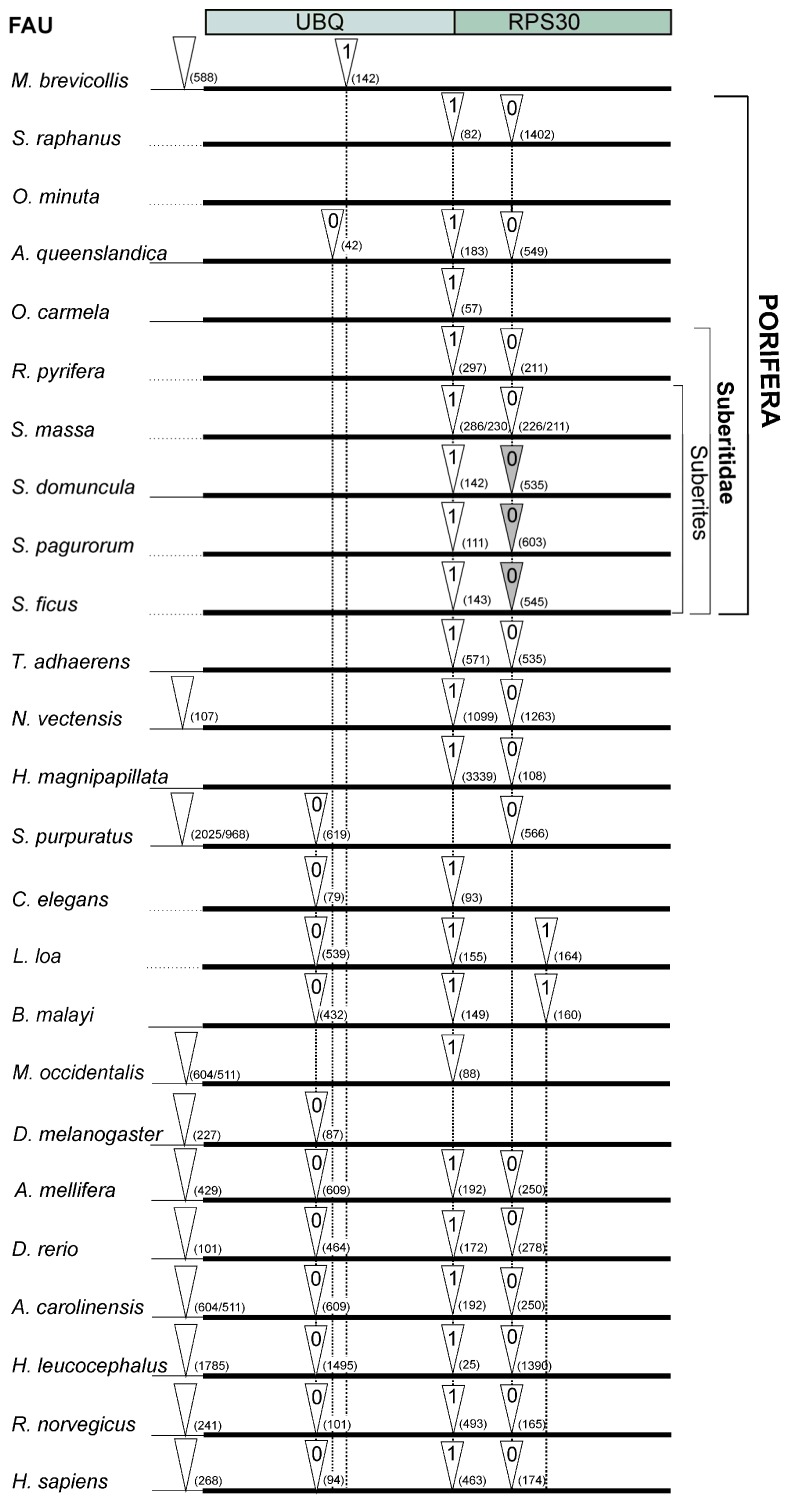
Figure 2.
Intron-mapping of FAU genes from representative species. White triangles indicate positions of the introns and gray triangles indicate presence of SNORA62. The number within triangle denotes the intron phase and the number in brackets intron length. The thin line indicates the 5′ UTR region.

