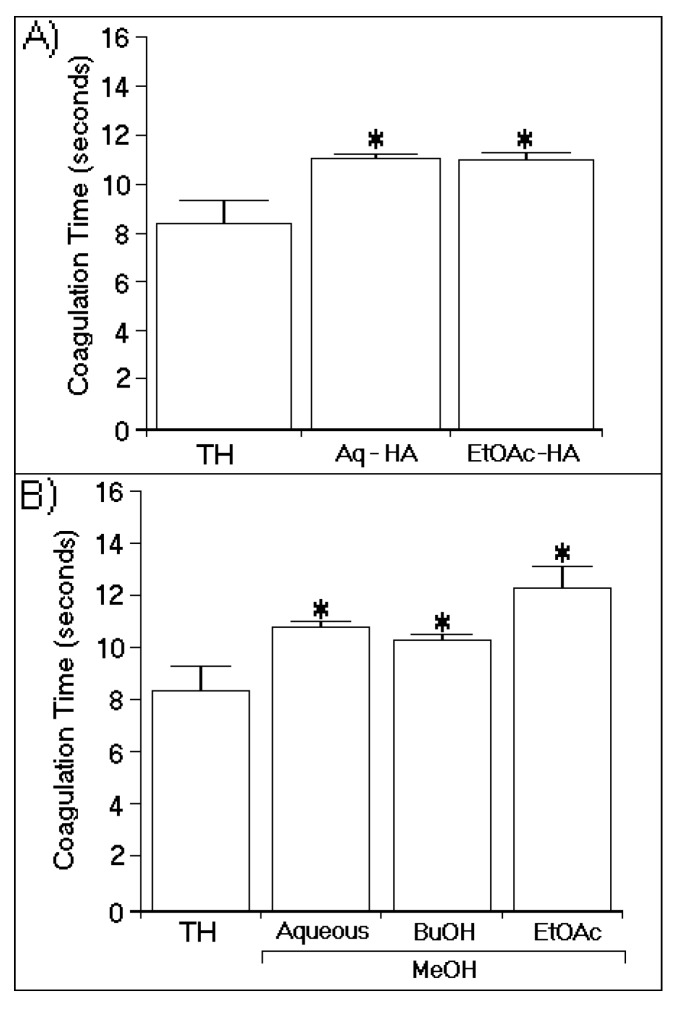
Figure 4.
Effects of all phases of the hydroalcoholic (A) and methanolic (B) extracts on the coagulation time, which was measured using a turbidity test based on the average thrombin time. The bars represent the standard deviations, and * indicates significant differences relative to a standard. All analyses were performed using analysis of variance (ANOVA, p < 0.05), and each bar represents n = 12.

