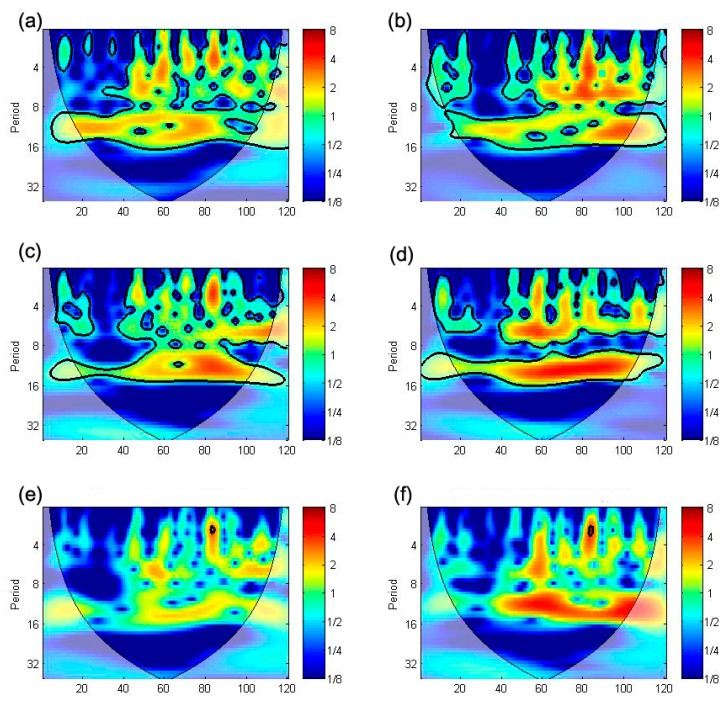
Figure 9.
Cross wavelet analysis results between scrub typhus and processed meteorological predictors (removed seasonality): scrub typhus with (a) mean temperature; (b) precipitation; (c) relative humidity; (d) wind speed; (e) duration of sunshine; and (f) cloud amount; bold line indicates 95% confidence inbound which is statistically significant and white transparency area indicates un-confidence area, and blue to red colors indicate the temporal correlation scale with each color-map index.

