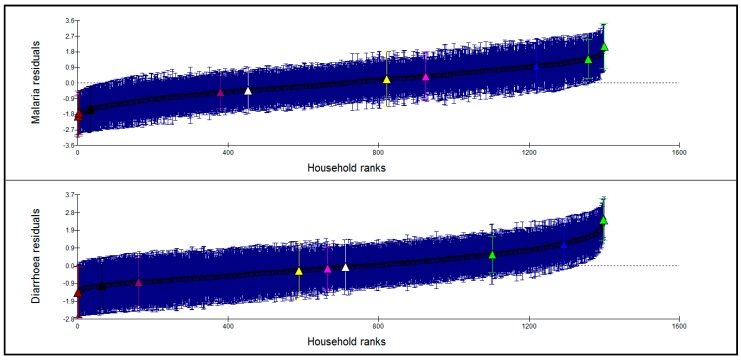
Figure 2.
Caterpillar plot of household residuals for malaria and diarrhea prevalence. The dotted line is the mean of the estimated (shrunken) residuals, which is equal to zero (estimated or shrunken residual for group j is the residual obtained by multiplying the mean of the residuals of subjects in group j by a shrinkage factor. Shrinkage factor shrinks an observed group mean towards the centre of the population mean). The brushes represent 95% CI to the estimated residuals.

