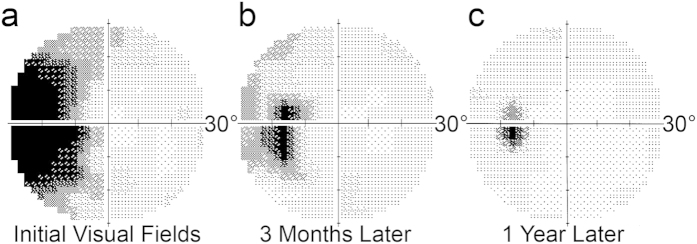
Figure 1. Onset and resolution of AIBSE.

(a) Map of the central 30° of the visual field in the left eye plotted a month after the development of vision loss showing an enormous blind spot. The grayscale depicts retinal sensitivity, with black representing no response to the brightest stimulus generated by the perimeter. (b) Three months later, the scotoma has shrunken. (c) A year later, there is further improvement, although the blind spot is still twice normal size.
