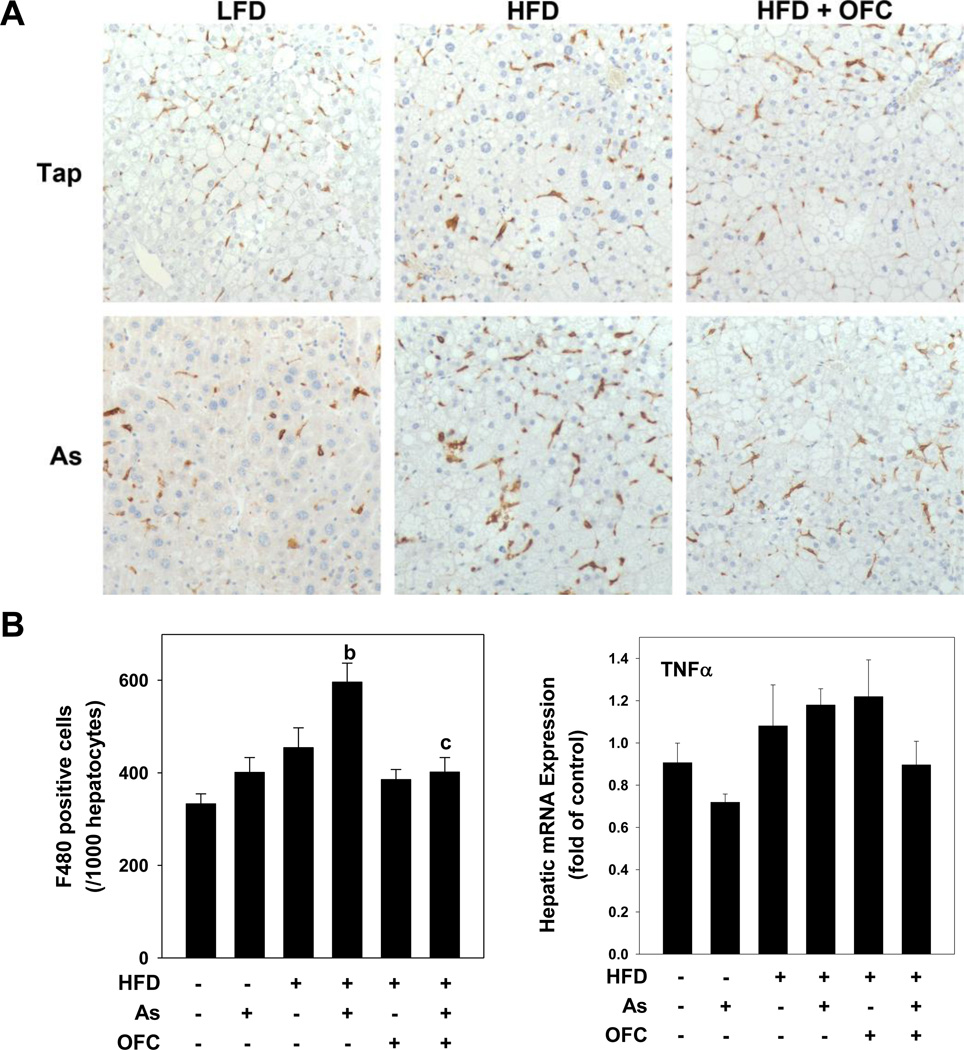
Figure 3. OFC protects against hepatic inflammation.
Animals and exposures to high fat diet (HFD), arsenic (As), and the prebiotic oligofructose (OFC) were as described in the Methods. Panel A shows representative photomicrographs of immunohistochemical staining for F4/80 (200×) in which hepatic macrophages are stained brown. The left graph of panel B shows quantitation of F4/80 staining, which was determined by blinded counting of the number of F4/80 positive cells per 1000 hepatoctyes as described in Methods. The right graph of panel B shows real time RT-PCR for the pro-inflammatory gene TNFα, which was performed as described in Methods. Quantitative data are shown as means ± SEM (n = 6–10). a, p < 0.05 compared to tap water control; b, p < 0.05 compared to LFD; c, p < 0.05 compared to no OFC.

