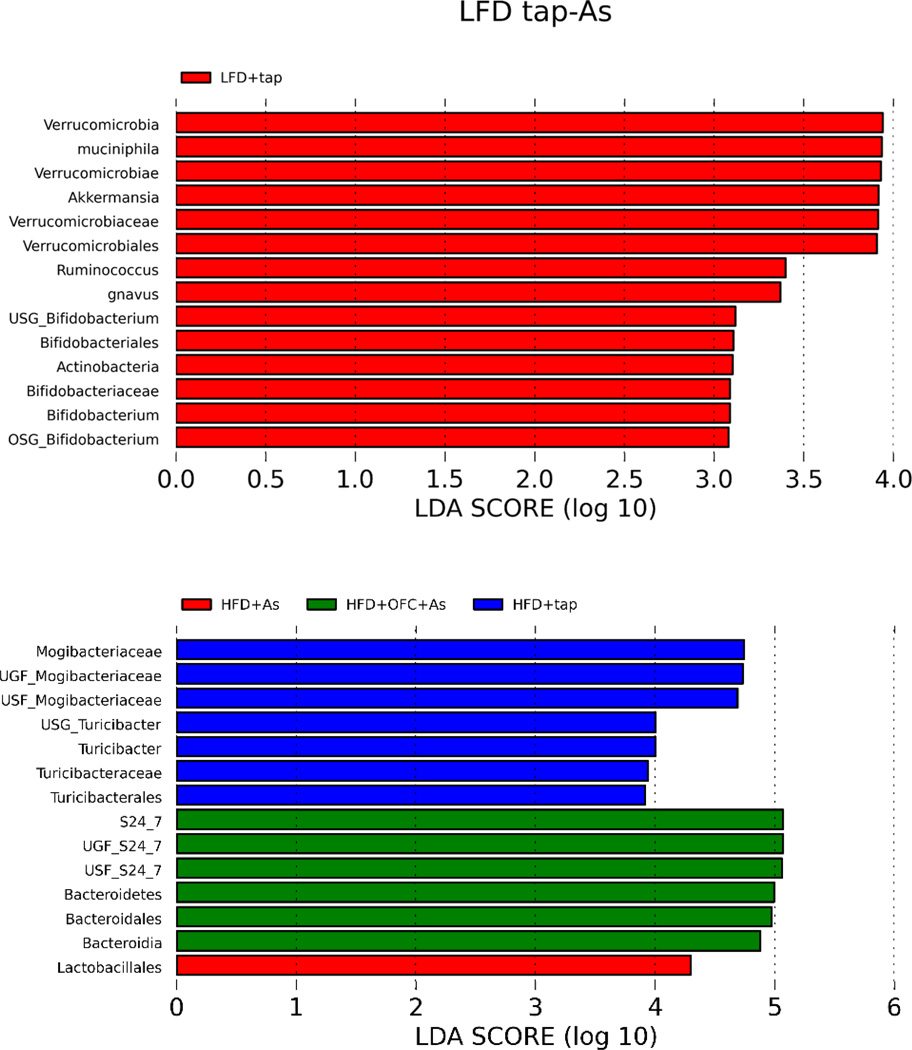
Figure 7. LefSe analysis of microbiome changes.
Panel A shows a bar plot of LefSe analysis comparing the gut microbiomes of animals fed either LFD or a LFD and arsenic. Each bar represents a bacterial taxa that was enriched by LFD. The length of the bar represents the effect size. Panel B shows a bar plot of LefSe analysis comparing the gut microbiomes of animals fed either HFD (blue), HFD and arsenic (red), or HFD, arsenic, and OFC (green). The length of the bar represents effect size.

