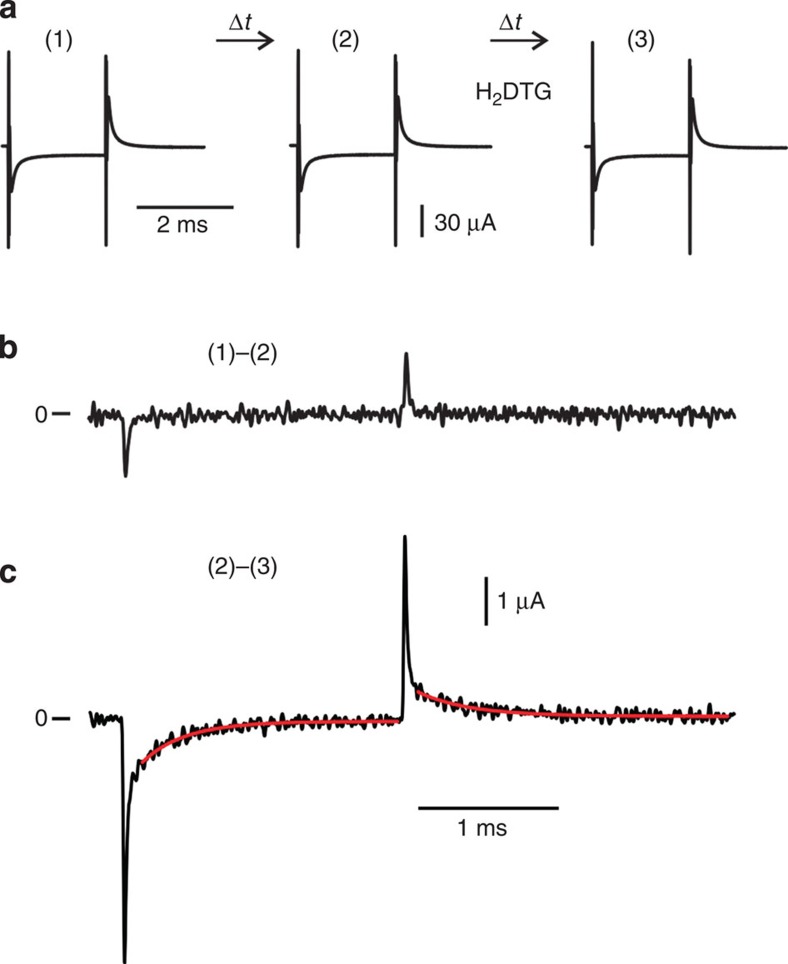
Figure 2. Charge movement mediated by extracellular K+.
(a) Experimental protocol. Current traces (1)–(3) represent the total membrane current in response to a voltage step from 0 to −160 mV acquired at 2 μs per point, filtered at 100 kHz, in the presence of 1 mM external K+ and at equal time intervals. Between traces (2) and (3), 100 μM H2DTG was applied to the external solution. (b) Pump-mediated K+ charge movement: time control. Subtraction of trace (2) from (1) provides an evaluation for the stability of the preparation. Time control signals have temporal decays comparable to the voltage clamp speed and they likely originate from changes in series resistance69. Trace was digitally filtered at 25 kHz for display. (c) Pump-mediated K+ charge movement: H2DTG-sensitive transient currents. Current trace corresponds to the charge movement during binding/occlusion of external K+. Solid red lines represent single exponential fits with time constants of 306 and 370 μs at −160 and 0 mV, respectively. Trace was digitally filtered at 25 kHz for display.

