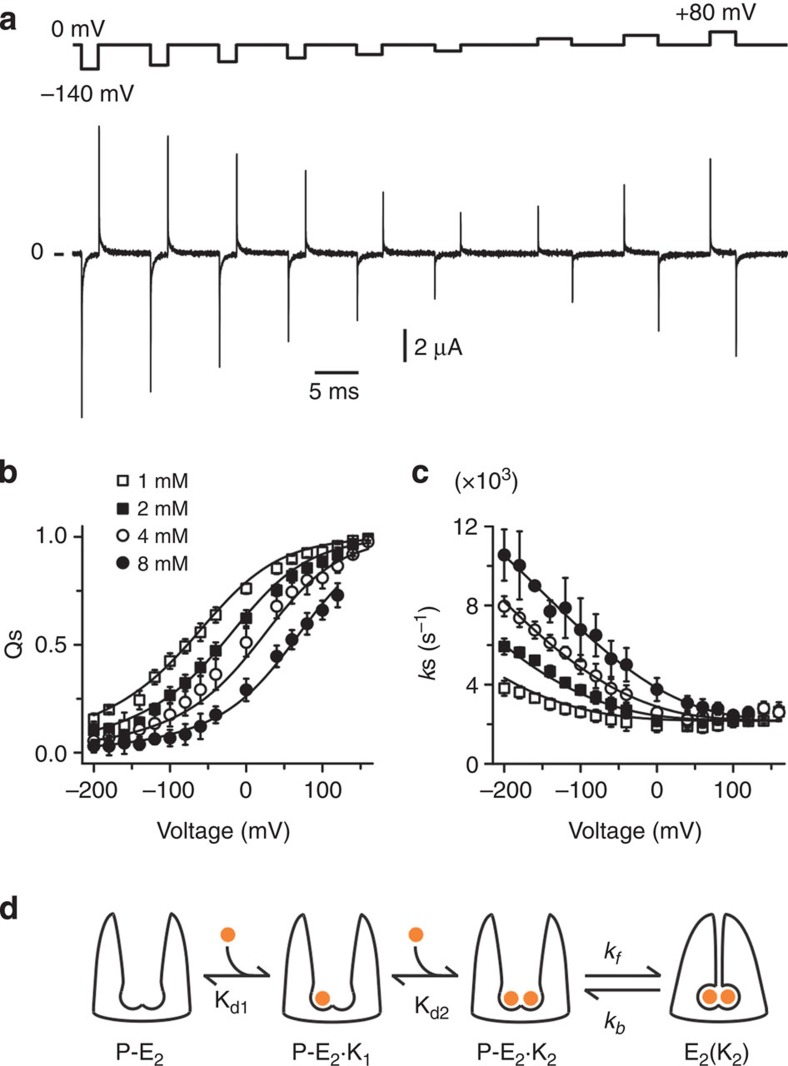
Figure 4. Voltage and external K+ dependence of the relaxation rate and charge moved by Qs during K+ occlusion.
(a) H2DTG-sensitive transient currents in response to a family of voltage steps from −140 mV to +80 mV in 1 mM external K+. (b) Charge displaced (Qs) versus voltage at different external K+ concentrations. (c) Relaxation rates (ks) versus voltage at different external K+ concentrations. (b,c) n=9, 12, 8 and 5 for 1, 2, 4 and 8 mM K+, respectively; scale bars represent s.d. (when not shown, s.d. was smaller than the symbol size). (d) Four-state access channel model with two consecutive K+-binding events that precede a single occlusion transition in which both ions are trapped within the permeation pathway of the pump. The two sequential voltage-dependent K+-binding reactions steps are fast and in equilibrium with the slow voltage-independent occlusion/deocclusion transition. In this model, the two K+-binding sites are assumed to be distinct with no cooperativity between them (see, for example, refs 16, 19). A global fit of this model to ks and Qs data (solid lines in b) gave the following best-fit parameter values with their 95% confidence interval in parenthesis: Kd1(0)=2.6 (2.3, 3.0) mM, Kd2(0)=42.7 (35.7, 49.7) mM, λ1=0.46 (0.43, 0.48), λ2=0.27 (0.25, 0.29), occlusion rate (kf)=13,450 (12,087, 14,813) s−1 and deocclusion rate (kb)=2,170 (2,095, 2,247) s−1; r2=0.99. In addition to have a more straightforward physical interpretation, this model fit the data statistically (F-test, P>0.99) better than the single binding/occlusion model of Supplementary Fig. 4.

