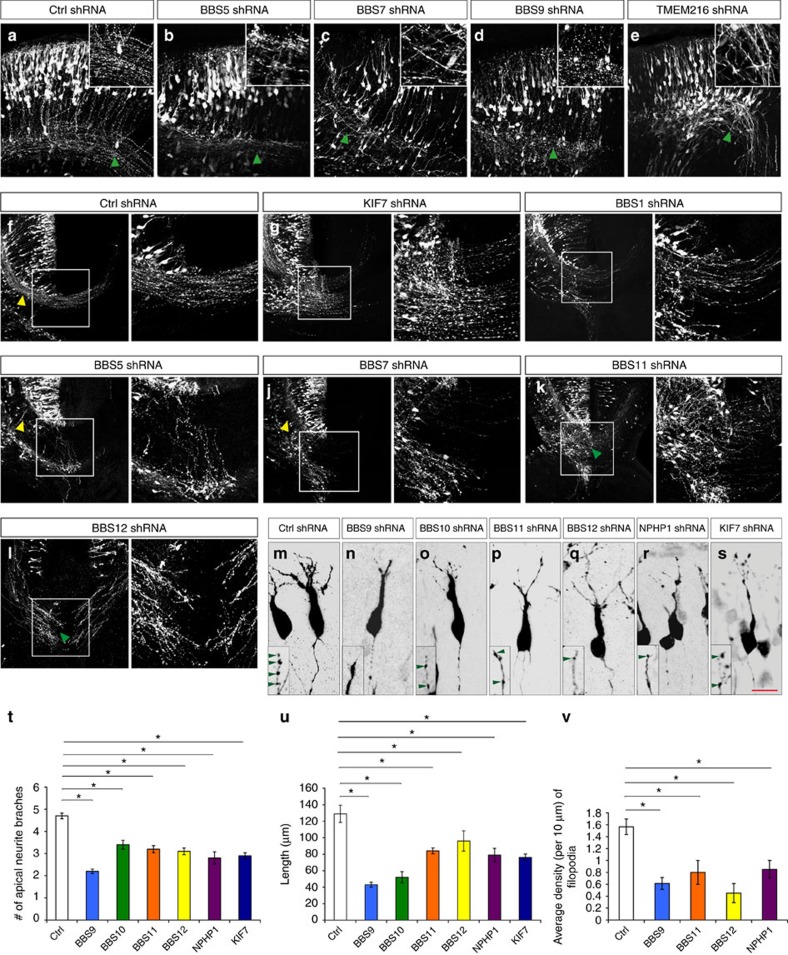
Figure 5. Effect of ciliopathy genes on post-migratory neuronal differentiation.
Embryos were electroporated with shRNAs at E14.5 and analysed at E18.5. (a–e,k,l) GFP+ neurons expressing BBS5 (b), BBS7 (c), BBS9 (d), TMEM216 (e), BBS11 (k) and BBS12 (l) shRNAs display axonal fasciculation defects (compare areas indicated by green arrowheads, insets (a–e)). (f–l) GFP+ neurons expressing shRNA against KIF7 (g), BBS1 (h), BBS5 (i), BBS7 (j), BBS11 (k) and BBS12 (l) display midline crossing defects in the developing cerebral wall. GFP+ neurons expressing shRNA against BBS5 (i), and BBS7 (j) also display reduced axonal outgrowth (compare areas indicated by yellow arrowheads in f, i and j. Right panels in f–l show higher-magnification images of the outlined (box) area in f–l. (m–s) Neurons expressing BBS9 (n), BBS10 (o), BBS11 (p), BBS12 (q), NPHP1 (r) and KIF7 (s) shRNAs display significantly reduced total non-axonal neurite length and branching. (t,u) Quantification of average apical neurite number (t) and total length (u) in control and BBS9-, BBS10-, BBS11-, BBS12-, NPHP1- and KIF7-deficient neurons. (v) Quantification of filopodial density in control and BBS9-, BBS11-, BBS12- and NPHP1-deficient neurons. Data shown are mean±s.e.m. *P<0.05 (Student's t-test). Number of brains per group=4. Scale bar, 80 μm (a–e); 148 μm (f–l); 18 μm (m–s).

