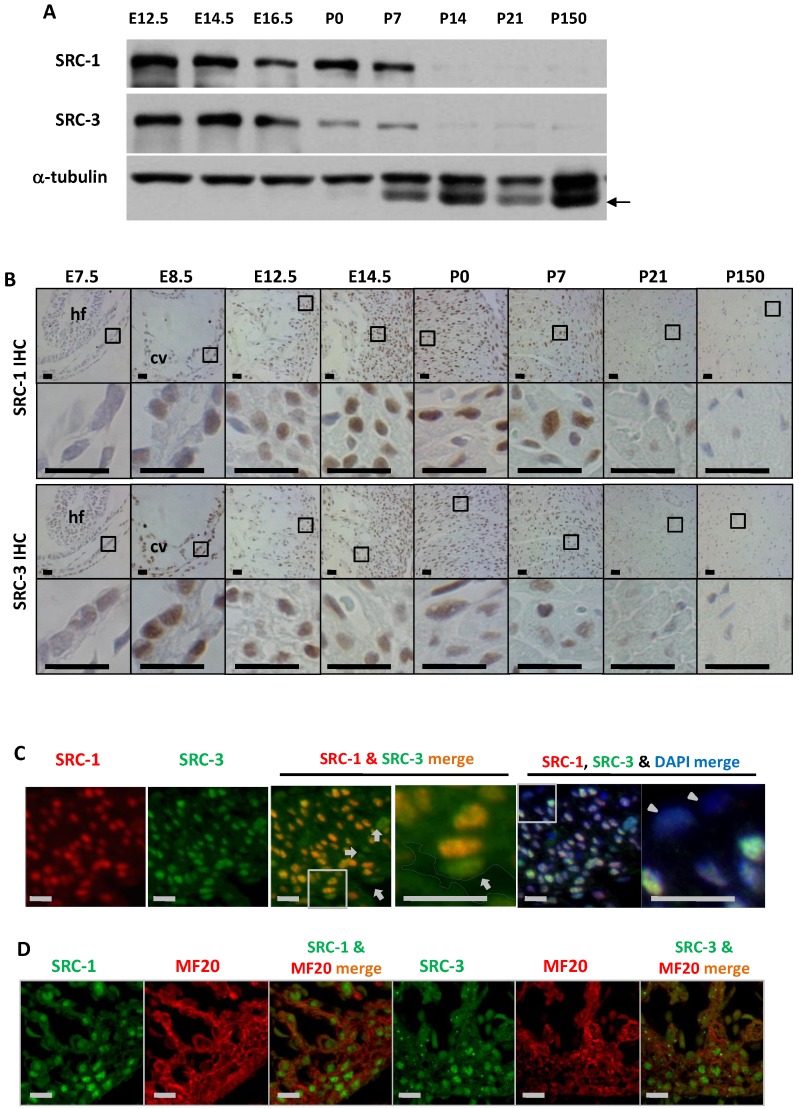
Figure 1.
The spatiotemporal expression patterns of SRC-1 and SRC-3 proteins during heart development. A. Western blot analysis of SRC-1 and SRC-3 in the hearts of E12.5, E14.5, E16.5, P0, P7, P14, P21 and P150 normal mice. Each tissue lysate was prepared from at least 3 mouse hearts. The α-tubulin served as a loading control. The arrow indicates a mouse IgG band detected by the secondary antibody. B. Detection of SRC-1 and SRC-3 positive cells by IHC in the E7.5, E8.5, E12.5, E14.5, P0, P7, P21 and P150 mouse hearts. The boxed areas in the first and third row panels are magnified in the second and fourth row panels, respectively. At least three mouse hearts at each stage were examined, and representative images were shown. hf, head fold; cv, common ventricular chamber of the primitive heart. C. Double immunofluorescent staining for SRC-1 and SRC-3 in the left ventricular wall of the E12.5 normal mouse heart. The nuclei were stained by DAPI. The boxed areas in the third and fifth panels are magnified in the fourth and sixth panels, respectively. The outlined area in the fourth panel indicates the heart chamber. The arrows indicate endothelial cells. The arrowheads indicate the epicardium. D. Double immunofluorescent staining for SRC-1 and MF20 and for SRC-3 and MF20 in the ventricular wall of the E12.5 normal mouse heart. Scale bars in panels B, C and D, 20 μm.

