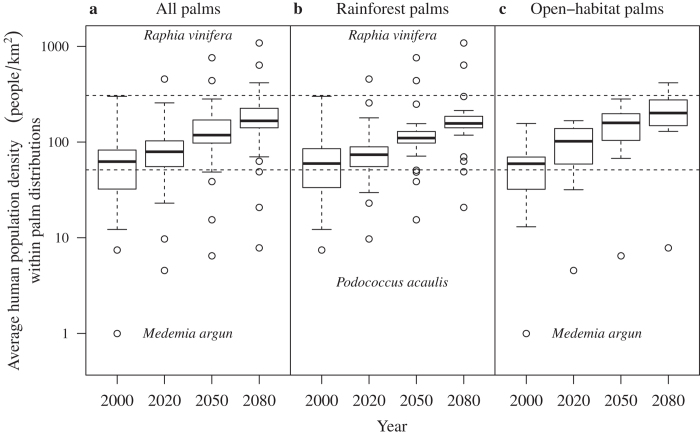
Figure 3. Average human population density within areas of palm distributions.
Average human population density (on log10 scale) within 100-km-dispersal ranges of (a) all palms (n = 40), (b) rainforest palms (n = 27) and (c) open-habitat palms (n = 11) for the +CO2 scenario (Methods) for four time periods in the 21st century. The upper and lower dotted lines mark population density in the densest populated country in Africa in year 2000 (Rwanda; 307 people/km2) and the continental-wide average human population density in year 2000 (50.14 people/km2), respectively. The most extreme outlier species for each group and time slice at high HPD are Raphia vinifera (panel a,b) and at low HPD Medemia argun (a,c) and Podococcus acaulis (b). Values are computed as arithmetic means of all model combinations of two species distribution models, three global circulation models and three gas emissions. The horizontal black bar is the median for each group per time period. The box indicates the interquartile range and whiskers extend to the most extreme data point, which is no more than 1.5 times the interquartile range from the box, while more extreme values are displayed as open circles.

