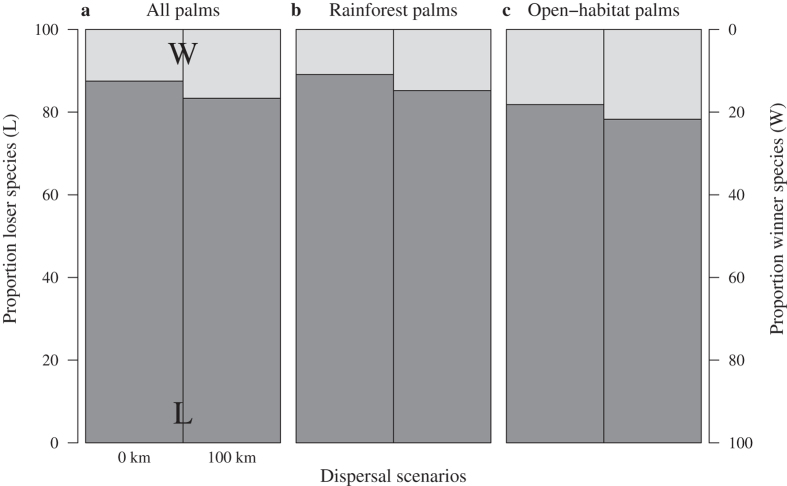
Figure 4. Proportion of palm species losing or gaining climate suitability within the protected area network in Africa, projected for 2080.
Proportion of (a) all palms (n = 40), (b) rainforest palms and (c) open-habitat palm species projected to lose (losers; L) or gain (winners; W) climate suitability in the protected areas across continental Africa by 2080 for two dispersal scenarios, no-dispersal (0 km) and 100-km-dispersal (100 km) for the +CO2 scenario (Methods). Values computed as arithmetic means of all model combinations of two species distribution models, three global circulation models and three gas emissions.

