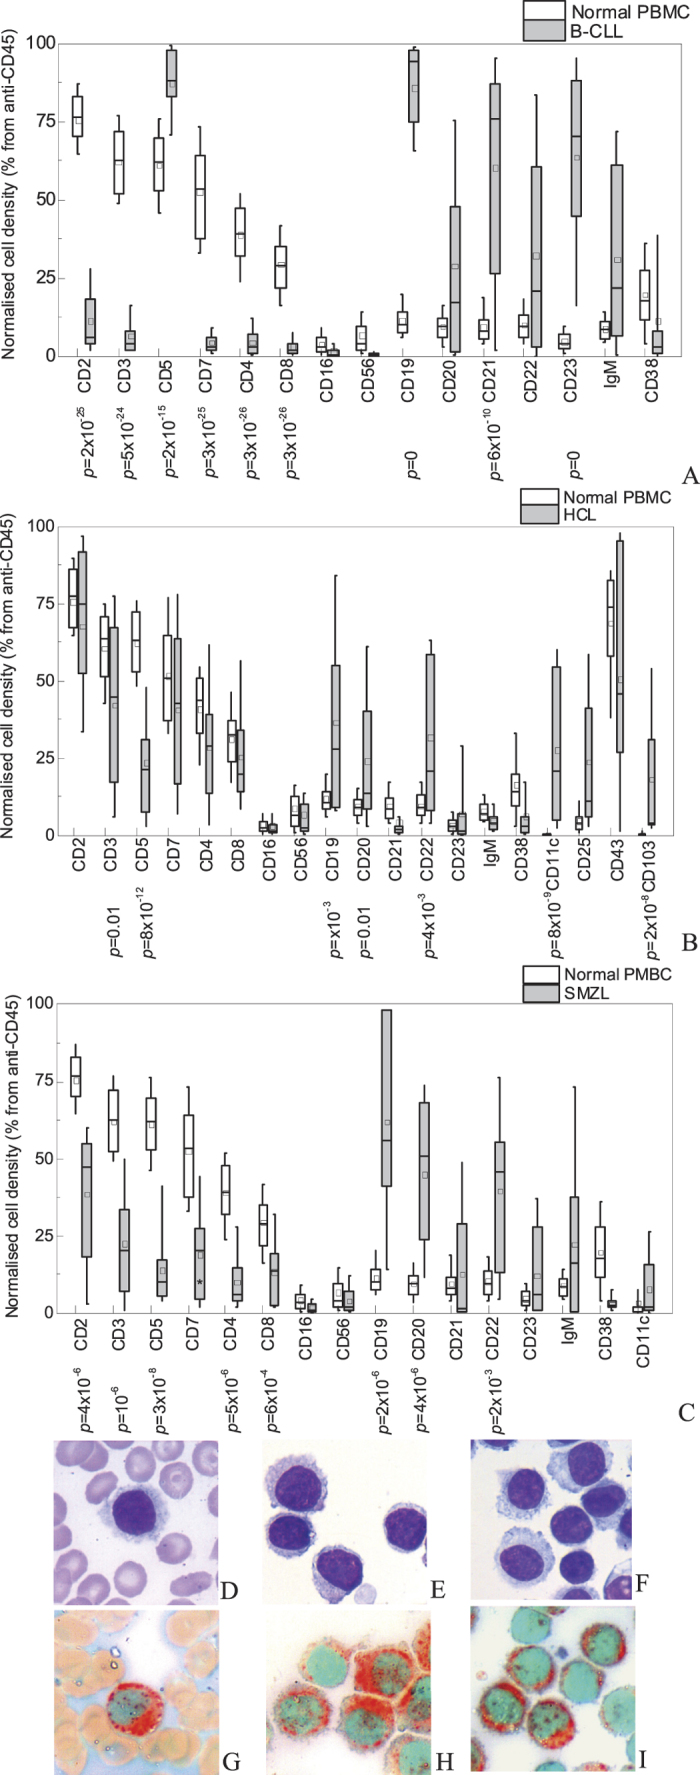
Figure 6. The microarray-captured mononuclear cells from the peripheral blood of the patients with chronic B-cell leukemias and lymphomas.

(A–C) The density of cells, captured by different anti-CD, normalised to the cell density on anti-CD45, for PBMC from 55 healthy donors (white boxes) and PBMC isolated from 22 patients with chronic B-lymphocytic leukemia (A, grey boxes), 20 patients with hairy cell leukemia (B, grey boxes) and 7 patients with splenic marginal zone lymphoma (C, grey boxes). The boxes indicate the 25%–75% confidence interval, the bars – 10%–90% confidence interval, the middle line indicate the median value, the square – the average value. The p values calculated according to Mann-Whitney U-criteria are given below the x-axis when below 0.05; (D–I) morphology after May-Grünwald-Giemsa stain (D–F) and cytochemistry test for tartrate-resistant acid phosphatase (G–I) of hairy lymphocytes and peripheral blood of the same HCL patient in a smear (D,G), on anti-CD45 microarray spot (E,H) and on anti-CD11c microarray spot (F,I). The leukemic cells are morphologically and cytochemically identical; anti-CD11c-captured cells are a pure hairy cell population. Original magnification ×1000 for panels D-I.
