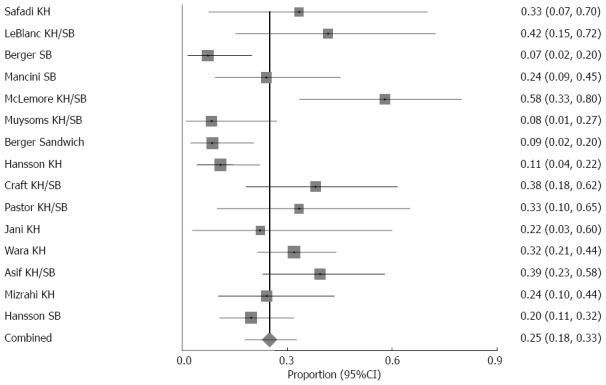
Figure 2.

Meta-analysis of proportion of overall complications for all techniques (random effects model; I2 = 69.9%, P < 0.001; Egger’s Bias = 3.13, P = 0.003). The square size represents the weight of the study, and the horizontal lines represent the 95%CI of the effect estimate.
