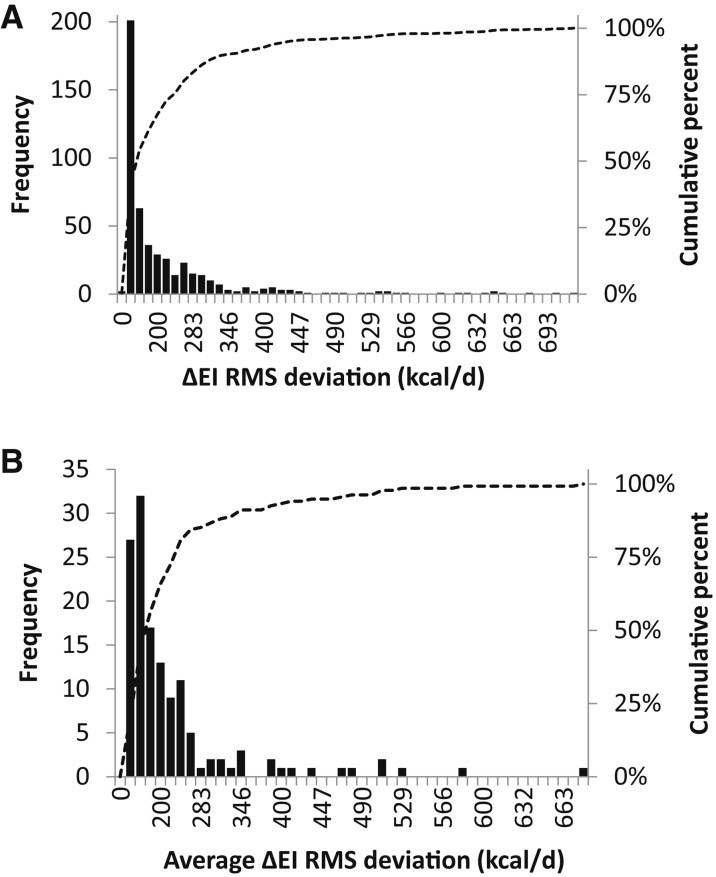
FIGURE 3.
(A) Distributions of the frequency (black bars) and cumulative percentage (dotted curve) of RMS deviations between the model and DLW/DXA method for individual ΔEI values at all time intervals. (B) Distributions of the frequency (black bars) and cumulative percentage (dotted curve) of RMS deviations between the model and DLW/DXA method for ΔEI values averaged over all time intervals for each subject. DLW, doubly labeled water; DXA, dual-energy X-ray absorptiometry; ΔEI, energy intake change from baseline; RMS, root mean square.

