Figure 1.

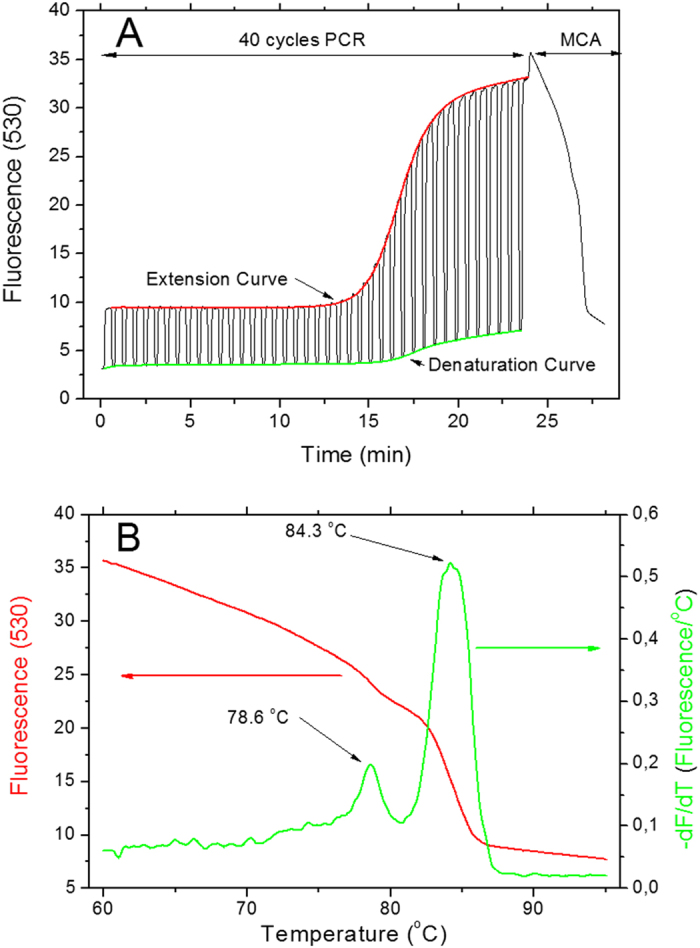
(A) A typical data set with both amplification curves extracted from a 40-cycle PCR. The fluorescence amplitude recorded at the end of the extension (red) and denaturation (green) step are shown here. The normalized amplification curves are shown as inset. At the end of the PCR we performed the MCA. (B) The results of the MCA analysis showing DNA templates with two different melting temperatures, 78.6 °C and 84.3 °C.
